Sunday, 27 December 2015

What I Learnt About Stock Investments from the DomiNations Game

A few months ago, I downloaded a mobile game called "DomiNations". This game is similar to the "Age of Empires", in which you develop your civilisation and lead it through different ages. 

DomiNations Game

Civilisation View

Besides developing buildings, you could also lead an army to attack and loot other players. Likewise, you could also be attacked by others. To master the game, I tried to search online for an official game manual which could describe the strengths and weaknesses of different buildings and army units, as well as how to place the buildings for the best defence. Unfortunately, I could not find a good game manual, much less an official one. It is like the stock market, isn't it, which does not come with an official game manual. It does not teach you what stocks to buy, when to buy and when to sell. Although this void is filled by many investment books written by others, there are still gaps. For example, there is actually no book that talks about "troubleshooting", which advises you what you should do when the stock market "malfunctions", i.e. crashes. 

Consider the recent stock market downturn in Aug, which book could you rely upon to advise you how to navigate the downturn? While there are many investment books on how to pick stocks, read technical charts, analyse financial statements and understand investor psychology, I am not aware of any book which is able to guide investors on how to navigate a stock market decline. The closest book I could think of is Jeremy Siegel's "Stocks for the Long Run", which shows that historically, Sep is the worst month for stocks and Oct is the most volatile month (but can be up or down). Even so, it is not a fool-proof guide; it requires quite a lot of faith to believe that the worst is over once you past Sep and Oct. It is also not a context-sensitive guide; does what is generally true apply to the economic situations we had in Sep when China was slowing, interest rates were rising and oil price was falling, etc? In situations where there are no official game manuals, there are only 2 ways that players can learn how to be a better player.

Learning from Mistakes

When there is no official game manual, the best way players can master the game is to experiment and learn what works and what does not. In the DomiNations game, I thought my original placement of defensive buildings was good. It worked the first time I was attacked, successfully repelling the attacker with minimal loss of gold and food resources. However, when a more sophisticated attacker came the second time, my city's defences were completely and utterly overrun! It exposed, firstly, fundamental flaws in my defensive placements, and secondly, but more importantly, over-confidence in my original defensive strategy. The moral of the story is this: when you win, you practically learn nothing, but when you lose, you learn a valuable lesson in what does not work. In fact, the greater the loss, the more deeply you will learn and not repeat it. The more mistakes you make, the more knowledge you gain on what does not work. Over time, as you gain more knowledge on what does not work, you will eventually become a better player.

Winning generally does not teach you anything. Most people, when they win, they will bathe in the euphoria of winning. Seldom will anyone analyse the reasons for the victory, and even if he does, he might attribute it to the wrong reasons, which will only serve to increase the hubris of the player and eventually lead to a greater downfall! To win, you need a combination of factors in your favour, but to lose, you just need one single key factor against you. Thus, when you win and you managed to find a reason for your victory, it might be only one out of many factors contributing to your win. But when you lose, the key factor resulting in your loss is usually clearly visible. As this might not be the only factor contributing to your loss, the more losses you have, the more factors you will be able to identify that affect the outcome of your battles. The more factors you are able to have in your favour, the more likely you are able to replicate success in your next battle. So, remember to learn from your mistakes!

Learning from Others

In the DomiNations game, you could join an alliance with other players, chat with them and observe their defensive placements. Likely, these players have been playing the game longer and gained a lot more experience than you have. To save time and efforts in learning from your mistakes, you could join an alliance and learn from them. Where there are unofficial game strategies written by experienced players, read them too. It will save you from a lot of unnecessary heartaches later!

Conclusion

While I might be describing my experience from playing a mobile game, these lessons are equally applicable to stock investments that do not come with an official game manual. Learning from mistakes and learning from others are the best ways to become a better investor. Despite having 29 years of experience in the stock market, I am still learning from mistakes and I also have alliance members whom I can learn from – investment books in the library and financial bloggers on TheFinance.sg and Singapore Investment Bloggers

Thanks for staying tuned to this blog throughout the year. Wishing all readers Merry Christmas and a Happy, Prosperous and Healthy 2016! 


Sunday, 20 December 2015

Is CPF Accrued Interest Double Counting of Housing Loan Interest?

This question has baffled me for quite a long time. When you use your CPF money to service your housing loan, CPF will compute accrued interest on the amount you withdraw from CPF until you sell the house. The accrued interest reflects the amount of interest you would get in your CPF account had you not used it to service the loan. When you sell the house, the principal and accrued interest have to be returned to CPF. This raises several other related questions – should accrued interest affects the attractiveness of the housing purchase and is better to use CPF or cash to service the housing loan?

To better appreciate and answer these questions, it is best to consider a typical scenario and leave CPF out of the picture for the time being. Let us assume that you intend to purchase a HDB flat for $500K. HDB agrees to loan you 90% of the purchase price. You will need to fork out the remaining 10% as downpayment. However, your kind-hearted parents, who have been working for several years and have accumulated some savings, willingly offer to pay the downpayment for you. You relunctantly agree, promising to pay them interest for the money loaned so that they could have sufficient money for their retirement. Thus, HDB pays 90% of the purchase price while your kind-hearted parents fork out the remaining 10% and you do not need to pay a single cent.

The HDB loan is a formal loan which requires monthly repayment, whereas the loan from your parents is an informal one which does not have any fixed payment terms, except for your promise to return the full amount borrowed plus accrued interest to them when you sell the house. Each month, you have to make repayment to HDB to pay down the formal loan. Again, your kind-hearted parents offer to service the monthly repayment so that you do not need to fork out a single cent every month. Thus, over time, as you pay down the HDB formal loan, you borrow more and more informal loan from your parents, with accrued interest growing increasingly with time and size of the informal loan. When you have fully paid off the HDB formal loan, you no longer need to borrow additional money from your parents, but the accrued interest continues to accumulate, until you sell off your house.

Assume further that you sell off the house for $1 million and the principal borrowed from your parents plus accrued interest amounts to $800K. As promised, you return $800K to your parents and retain the remaining $200K. Your kind-hearted parents accept the money, but assure you that whatever money they have will eventually belong to you as inheritance. Thus, it does not really matter whether you return $800K or $600K to them, because you will eventually get the full $1 million. 

Now, kind-hearted parents tend to have kind-hearted children. Assume that you decide to use a generous interest rate to compute the accrued interest such that the principal plus accrued interest amounts to $1.2 million. As this exceeds the sales proceeds from the house, you will return the full $1 million to your parents and get nothing. Your parents do not require you to cough up the remaining $200K owed to them. From your perspective, this looks like a "lousy" investment as you end up losing $200K on the housing purchase. However, can this really be considered a lousy investment, since the house doubles in value from $500K to $1 million? The computation of accrued interest merely affects how the sales proceeds are distributed to your parents and yourself. Considering that you will eventually get back the full $1 million, the accrued interest does not affect the attractiveness of the housing purchase.

Now, let us suppose from the beginning that you actually have some cash and do not need to rely on your parents' savings to service the downpayment and/or monthly repayment. Which of these would be a better option to service the loan – using your cash or your parents' savings? It all depends on who can grow the money at a higher rate. If you are able to invest your cash at a higher rate of return than your parents, then it is better to use your parents' savings to service the loan. Conversely, if your cash is left in the bank earning 0.05% interest rate while your parents' savings are able to grow at 2.5% annually, then it is better to use your cash to service the loan. 

We have come to the end of the story. Now, please replace the kind-hearted parents in the story above with your own CPF savings. It becomes a whole lot clearer what the CPF accrued interest is all about and whether it affects the investment and financing decisions. To summarise,
  • CPF accrued interest arises because you are taking out a second, informal loan from your CPF account to service the downpayment and/or monthly repayment so that you do not need to draw down your cash. It is not double counting of interest on your formal housing loan.
  • Computation of CPF accrued interest and return of principal plus accrued interest after the sale of the house merely affects the distribution of the sales proceeds between your CPF account and yourself. It does not affect the attractiveness of the housing purchase. The key interest rate that affects the investment decision is the housing loan interest rate, not the CPF interest rate used to compute the accrued interest. 
  • Whether to use CPF or cash to service the housing loan depends on their relative rates of return. Use the one with the lower rate of return to service the loan.

By the way, topping up your and/or your family members' CPF accounts with cash allow you to enjoy income tax reliefs of up to $7,000 (top-up for yourself) + $7,000 (top-up for family members) next year. If you have not done so, please hurry, before the year ends!


See related blog posts:

Sunday, 13 December 2015

Ahead of the Grand Battle

This time round, the US Federal Reserves is probably finally going to raise interest rates. Although the stock market is not at multi-year lows, the impact of the first interest rate rise in almost 10 years from an unprecedented low of 0.25% has far-fetched implications on currencies, commodities, bonds, stocks, properties and world economies. It is undeniably a grand battle on multiple fronts. 

If you have been following this blog, you will notice that my views on interest rate rises have shifted from being bearish in Jun (see Getting Ready for US Interest Rate Rises) to being optimistic at least in the short term in Sep (see A Jittery September). The economic implications of the interest rate rise are still valid, however, I believe that such expectations have been priced in and investor psychology of selling before a bad news would take centrestage at least in the short term. 

In line with this analysis, I have moved approximately 25% of my capital from cash into equities since the stock market rout in Aug just as most investors have moved in the opposite direction. Considering that the Straits Times Index is at a still-high level of 2,800 points versus the final battle during the Global Financial Crisis (GFC) which took place at 1,600 points, such a move appears premature. In fact, a post-event analysis of the investment decisions made during the GFC shows that it is better to wait for some clarity on the situation before making major moves (see Be Cautious While Being Greedy). In other words, is this period of rising interest rates reminiscent of Sep 2007 when stocks were beginning to collapse in an unfolding housing and financial crisis or Feb 2009 when stocks were making a recovery after monetary authorities around the world came to the rescue? Thus, a frantic search for some clarity began in Sep to make sense of the various economic developments since the stock market rout in Aug (see A Jittery September). Rightly or wrongly, some sense had been established with regards to the global economy to guide investment decisions, although the situation on oil & gas have become murkier as they have their own dynamics in addition to being influenced by interest rates.

Coming back to the move from cash into equities, it was also influenced by another factor. In the midst of this stock market roller-coaster, there was a little-heralded announcement in end Oct that affected very few people but shook the foundation of my equity-centric investment strategy. It was OCBC's announcement of its intention to redeem its 4.2% preference share. To understand the impact of this move on my investment strategy, you can refer to Behind Every Successful Bear Market Recovery is A Cash-Like Instrument, which was written when OCBC redeemed another of its preference share 2 years ago. This is the third time I am kicked out of a preference share, having been kicked out of OCBC5.1% and UOB5.05% preference shares previously.

Thus, I had to find a new parking place to replace the OCBC 4.2% preference share. DBS' 4.7% preference share is the most obvious choice. It still has another 5 years to run before it is eligible for redemption. However, the recent liquidity squeeze on fixed-income securities (see Sneak Attack on My Cash Reservoirs) made me reconsider the validity of my assumption that sufficient liquidity is always present when needed. Given the limited number of good fixed-income securities and the underestimation of liquidity risks in times of crisis, the portion allocated to fixed-income securities has to reduce. Moreover, I also dislike paying a high premium for fixed-income securities.

That leaves Singapore Government Securities (SGS), Singapore Savings Bonds (SSB), fixed deposits and cash as the options. While they are good in preserving capital and have very good liquidity, they lose value to inflation in the long run. Moreover, SGS is a poor choice in the current environment of rising interest rates. Cash will always be an important component of my portfolio, but too much of it will drag down the overall performance of the portfolio. So, instead of retreating further into the safety of cash & fixed deposits, I decided to advance deeper into equities, trying to look for 1-2 stocks which I could entrust my capital for a long period of time. It is a totally new investment strategy. Although this might not be the most comforting of times to move from fixed-income & cash into equities, if it were more comforting, the price would be higher.

In another 3 days' time, we will know whether this major move from fixed-income & cash into equities is sheer madness or justified confidence. I do not like war, but if war comes, I will respond accordingly. My biggest worry is the US Fed chickening out again, just like it did in Sep. If so, the casualties will be very heavy. The difference this time is I will no longer have OCBC's preference shares to cover my back.


See related blog posts:

Sunday, 6 December 2015

Do Retail Bond Investors Get the Poorer Deal?

When Frasers Centrepoint (FCL) announced the issue of its 7-year, 3.65% retail bond on 12 May 2015, it was preceded by another announcement just a day earlier regarding the issue of a perpetual securities that carry a coupon rate of 5.00%. In fact, the perpetual securities were not the only bonds issued by FCL since its listing on SGX in Jan 2014. There were 2 other bonds, namely a 4.88% perpetual securities and a 7-year, 3.95% Fixed Rate Notes, both issued in Sep 2014. Thus, among all the bonds issued by FCL within a short span of 8 months, the 7-year, 3.65% retail bond has the lowest coupon rate. All other wholesale (i.e. non-retail) bonds have higher coupon rates. It raises the question whether retail investors have the poorer deal when it comes to new bond offerings.

Shortly after FCL's retail bond issue, Aspial, Perennial and Oxley all issued their own retail bonds with coupons ranging from 4.65% to 5.25%. Like FCL, all 3 companies have issued wholesale bonds before the retail bond offering. Let us study whether it is true that retail investors have the poorer deal when it comes to new bond offerings. 

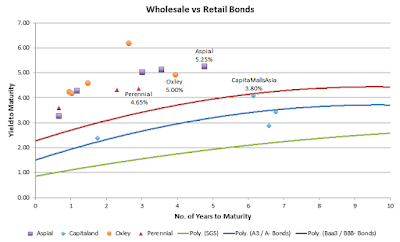
The figure below shows the Yield-to-Maturity (YTM) of the various bonds issued by the above-mentioned companies that are available on Bondsupermart. Each colour represents all bonds issued by a particular company. The retail bonds are identified by a label next to the points. As an example, Aspial have 5 existing bonds, shown in purple in the figure. Its retail bond has the highest YTM and longest maturity among all its bonds. Also shown in the figure are the 3 lines representing the YTM of the risk-free Singapore Government Securities (SGS), high investment-grade bonds rated A3 by Moody's and the lowest investment-grade bonds rated Baa3 by Moody's. These lines provide a reference to determine whether the bonds are fairly priced or not. Please see Benchmarks for Retail Bond Pricing for more details on how to price a bond.

Fig. 1: Wholesale Bonds versus Retail Bonds

At first glance from Figure 1, the retail bonds appear to be priced fairly in line with their wholesale cousins after accounting for unique bond features that could introduce a premium or discount to the YTM, such as putable features (which results in lower YTM) and callable or step-up coupon features (which results in higher YTM). However, on closer look, there are differences in the yield spread between wholesale bonds and retail bonds. In bond pricing, every 0.01% in yield counts. 0.01% is so important that it has a special name – a basis point. If you compute the YTM spread between the bonds and Baa3-rated bonds, retail bonds have lower spreads compared to their wholesale cousins ranging from 0.11% to 0.30%. What it means is that retail bonds are actually more expensive.

The correctness of the above analysis is dependent on 2 assumptions, namely, (1) the spread is constant across all bond maturities and (2) the reference yields are correctly constructed. In view of these limitations, let us consider perpetual bonds which do not have such limitations. There are 3 perpetual bonds listed on SGX, namely, DBS 4.7%, Genting 5.125% and Hyflux 6%. Like the other companies mentioned above, they also have wholesale perpetual bonds. Let us look at each of them.

Fig. 2: DBS' Perpetual Bonds

Figure 2 shows the perpetual bonds issued by DBS. The first bond (DBSSP 4.700% Perpetual Pref) is a retail bond. As can be seen from the figure, it has the lowest YTM among all the bonds.

Fig. 3: Genting's Perpetual Bonds

Figure 3 shows the perpetual bonds issued by Genting. Both bonds have the same coupon, but the first one is the retail version. Again, it has a lower YTM compared to its wholesale cousin.

Fig. 4: Hyflux's Perpetual Bonds

Figure 4 shows the perpetual bonds issued by Hyflux. The first bond (HYFSP 6.000% Perpetual Pref) is the retail bond. Similarly, it has the lowest YTM among all the bonds.

Thus, it is fairly conclusive that retail bonds are priced more expensively compared to their wholesale cousins. This is to be expected, since wholesale bonds are traded in multiples of $250,000 and hence not accessible to most retail investors. Nevertheless, retail investors should be vigilant and not let ourselves be taken advantage of.

P.S. I am vested in FCL's 3.65% bond and CapitaMallsAsia's 3.8% bond.


Sunday, 29 November 2015

Benchmarks for Retail Bond Pricing

There are a couple of retail bonds listed on the SGX. How do you tell whether the 5.25% coupon offered by Aspial's 5-year bond is too high or the 3.65% coupon offered by Frasers Centrepoint's (FCL) 7-year bond is too low? To determine the right pricing for these bonds, you need to know what is the credit rating of the bond and the Yield-to-Maturity (YTM) for bonds with similar ratings. Unfortunately, the majority of retail bonds listed on SGX are not rated. On the other hand, thanks to Bondsupermart, we now have benchmarks to determine the YTM and pricing for bonds with various ratings. The blue line in the figure below shows the YTM for bonds rated A3 by Moody's (equivalent to A- by S&P / Fitch), which is the lowest of all A-grade bonds. The red line shows the YTM for bonds rated Baa3 by Moody's (equivalent to BBB- by S&P / Fitch), which is the lowest of all investment-grade bonds. Also shown in the figure in green is the YTM for the Singapore Government Securities (SGS), which provide a risk-free return for various bond maturities. This green line is also known as the Yield Curve. The difference between a bond's YTM and the yield curve at the same bond maturity is known as the spread and is commonly used to measure the pricing of a bond. Actually, you can construct a different line for each bond rating, but for ease of discussion, we will show only 3 lines in this figure.

YTM for A3/A- and Baa3/BBB- Bonds

The YTM of retail bonds listed on SGX are plotted as purple points in the figure above. The YTM has considered any step-up coupon feature in the bond, which is why CapitaMallsAsia 3.80% bond has a YTM of 4.064% even though its coupon is only 3.80% (this step-up will only apply if the bond does not get redeemed early). Among the 6 retail bonds with maturities of less than 10 years, only CapitaMallTrust's (CMT) 3.08% bond is rated A2 by Moody's. Let us use this as an example to explain how bonds are priced. CMT bond's rating of A2 is 1 grade higher than A3 which is represented by the blue line. As shown in the figure above, CMT bond's YTM is slightly below the blue line. Since CMT bond is less risky than A3-rated bonds, it should have a lower YTM than A3-rated bonds. Thus, CMT's 3.08% bond is correctly priced.

All the other retail bonds do not have any credit rating. We have to estimate a probable credit rating for the bond and from there, determine if it is overpriced or underpriced. Using FCL's 3.65% bond as an example, the YTM is closer to the blue line (A3 / A- bonds) compared to the red line (Baa3 / BBB- bonds) as shown in the figure above. If we think that FCL bond's rating is closer to Baa3 / BBB- than A3 / A-, then its YTM should increase to that of Baa3 / BBB- bonds (i.e. price should decrease). 

How do you compute the price of a bond from its YTM and vice versa? There are simple tools to do so. One such tool is posted on the SGS website. Just enter the maturity date, coupon rate and YTM and compute the price (or vice versa). As an example, the price of FCL's bond is currently $0.990, which translates to a YTM of 3.826%. If we think FCL's bond should have a Baa3 / BBB- rating, its rightful YTM should be 4.216% as shown in the figure above. Based on this YTM, the price for FCL's bond should be $0.968.

Finally, although we do not know the credit rating of Aspial's 5.25% bond, Oxley's 5.00% bond and Perennial's 4.65% bond, they are all priced above the red line, which means that the market thinks they are not investment-grade bonds. This is consistent with the analysis based on Benjamin Graham's criteria of earnings coverage and stock value ratio, which showed that all 3 bonds (together with FCL's 3.65% bond) do not have sufficient margin of safety. Readers will have to assess for themselves if the higher coupons offered by the bonds are sufficient to compensate for the risks in investing in them. 

P.S. I am vested in FCL's 3.65% bond and CapitaMallsAsia's 3.80% bond.


See related blog posts:

Sunday, 22 November 2015

Is Benjamin Graham's Art of Bond Investment Outdated?

There were 4 retail bonds issued this year, yet all 4 were assessed not to have sufficient margin of safety according to Benjamin Graham's criteria of earnings coverage and stock value ratio. Despite so, all 4 bonds have hovered around the par value since listing. Is Benjamin Graham's art of bond analysis as described in The Lost Art of Bond Investment outdated?

To answer this question, let us go back to the first principles. The safety of a bond depends both on the issuer's ability to pay and willingness to pay. The ability to pay in turn depends on the issuer's recurring earning capability and/or adequacy of assets to extinguish the bonds. The willingness to pay depends largely on the management's integrity and is usually safeguarded by convenants in the bond agreement restricting management's rights, such as declaring excessive dividends to shareholders, or allowing bondholders to take over the company in the event of a default. Benjamin Graham's criteria measure the issuer's ability to pay and the 2 criteria of earnings coverage and stock value ratio measure the issuer's recurring earning capability and adequacy of its assets respectively. Although they were derived more than 80 years ago, the concepts are still relevant today and can be found in today's loans, including the housing mortgage loans that most people are familiar with. Interestingly, all the 4 retail bonds were issued by property developers. Let us visit each one of the criteria.

Earnings Coverage

The earnings coverage is more commonly known as interest coverage in today's age. It measures how much cushion the company's recurring earnings has to cover the total interest expense from all loans. The inverse of the earnings coverage would be equivalent to the Total Debt Servicing Ratio (TDSR) introduced by the Monetary Authority of Singapore (MAS) to determine how much of a person's salary could be used to service all the loans he has and hence how much loan he could obtain to purchase a property. Using industrial bonds as an example, Benjamin Graham recommended an earnings coverage of not less than 3 times fixed charges. This translates to a TDSR of 33%. Although this figure looks low compared to MAS' allowable TDSR of 60%, it has to be considered that individuals have mostly stable salaries, whereas companies' earnings are quite variable from year to year. The more variable the earnings are, the lower the TDSR should be. In fact, for bonds of public utilities which have more stable earnings, Benjamin Graham allowed a lower earnings coverage of 1.75 times fixed charges, which translates to a TDSR of 57%, which is quite close to MAS' allowable TSDR of 60%. Considering the variability of earnings of property companies, an earnings coverage of 3 times fixed charges is not excessively stringent. 

Stock Value Ratio

The stock value ratio measures how much cushion the company's equity could provide to the bonds in the event the company loses money. It is measured as the ratio of equity to total debt. In today's age, the related but more commonly used yardstick is the Loan-to-Value (LTV) ratio, which measures the ratio of debt to asset value. Using industrial bonds as the example, Benjamin Graham recommended a stock value ratio of not less than 1. This translates to a LTV of 50%. Again, although this figure looks low considering that individuals could borrow up to 80% of the property price, it has to be considered that individuals pay down their loans over time whereas companies mostly roll-over their loans when they mature. Thus, the LTV for individuals decline over time whereas the LTV for companies mostly stay constant. Moreover, individuals' mortgage loans are secured using the property as collateral, whereas companies' loans may either be secured or unsecured. A more appropriate benchmark would be the 45% leverage limit imposed by MAS on REITs. From this angle, the stock value ratio of 1 for property companies is not excessively stringent. For public utility bonds, Benjamin Graham allowed the stock value ratio to go up to 2 times, which translates to a LTV of 67%.

Other Considerations

Having too much debt does not necessarily means that a company will default on its bonds. It is akin to an individual with high cholesterol; while it places the individual at risk of a heart attack, it does not mean that one will definitely occur. The catalyst for a heart attack for companies would be a credit crunch or a sharp or prolonged industrial downturn in which the company is unable to find a bank willing to refinance its debts or a buyer willing to buy over its assets at reasonable prices. One of the biggest lessons REIT investors learnt from the Global Financial Crisis is that in times of crisis, having a strong parent helps. REITs with deep-pocket parents such as CapitaComm or A-REIT weathered the storm better than REITs without such parents. 

To conclude, Benjamin Graham's art of bond analysis is still as relevant today as it was formulated 80 years ago. 

Finally, you probably have heard the story that banks are famous for being fair-weather friends; they are nowhere to be found when you need the money but beg you to take the money when you do not need it. As bondholders, we should learn from the banks, i.e. lend money only to those who do not need it!

P.S. I am vested in Frasers Centrepoint's 3.65% bond (held as available-for-sale instead of held-to-maturity).


See related blog posts:

Sunday, 15 November 2015

Does FCL's 3.65% Bond Have Sufficient Margin of Safety?

I realised I had omitted the analysis for Frasers Centrepoint's (FCL) 7-year, 3.65% retail bond when it launched its Initial Public Offering in May. Since FCL announced its latest full-year financial results a week ago, here is the analysis according to Benjamin Graham's criteria of average earnings coverage and stock value ratio.

Earnings Coverage

Profit before tax, fair value changes & exceptionals = $955.4M
Adjusted for:
- Deduct: Share of associates' & joint ventures' results = $279.4M
- Add: Finance cost = $186.2M
Total earnings available for covering fixed charges = $862.1M


Finance cost = $186.2M


Earnings Coverage = $862.1M / $186.2M

= 4.63

The earnings coverage of 4.63 times is above the minimum average earnings coverage of 3 times for industrial companies.

Stock Value Ratio

No. of shares = 2,895.0M
Share price = $1.63
Market value of shares = $4,718.9M


Total borrowings = $9,255.3M


Stock value ratio = $4,718.9M / $9,255.3M

= 0.510

The stock value ratio of 0.510 is lower than the minimum stock value ratio of 1 for industrial companies.

Quantitative Assessment

Thus, FCL's bond meets the earnings coverage criterion but not the stock value ratio criterion. Based on Benjamin Graham's criteria, FCL's 7-year, 3.65% bond does not have sufficient margin of safety.

Other Considerations

Although the focus of the financial assessment should be on the company issuing the bond, we could look towards the parent company if the issuer company does not have adequate financial resources. In the case of FCL, it is the subsidiary of F&N, which is in turn a subsidiary of TCC Assets. If we can be sure that F&N will not completely sell off FCL, then we can assume that F&N will come to the rescue of FCL should it encounter difficulties in paying interest and/or principal.

Thus, for the above reason, I am vested in FCL's 3.65% bond even though it does not meet all of Benjamin Graham's criteria (Note: it is held as an available-for-sale instead of held-to-maturity investment).


Sunday, 8 November 2015

No, I Didn't Buy OSIM at 6¢ During GFC

I was originally blogging on the "bear market" theme before the unexpected stock market recovery in early Oct and the retail bond issuances in mid Oct disrupted the plan. Since the "big bad bear" looks like it is not coming any more, let's end this theme with this post.

You might probably have come across blog posts that said if you had bought OSIM at its all-time low during the Global Financial Crisis (GFC), you would have become very rich. That can be quite true. If you look at the figure below, OSIM touched an all-time low of 5¢ before recovering to a high of $2.90, for a 58-bagger. It is the stuff that most investors could only dream of.

OSIM Share Price

But no, I did not buy OSIM during the GFC and here is my side of the story. Please do note that when I say "thinking of buying OSIM" in this post, what it really means is that the thought crossed my mind but I did not seriously intend to put money into it. It had too much debt for my liking and it lost a lot of money during that period due to a poor acquisition in US. I did not put it on my watchlist, hence, I only saw it from time to time. It is like entering the supermarket occasionally and seeing something on sale and thought of buying it but eventually walking away without doing so. Nevertheless, a decision not to do something is as real as a decision to do something.

The first time the thought of buying OSIM crossed my mind was when it was trading at $1. I told myself that I would consider buying it when it reached $0.60. $0.60 came, but I decided to give it a pass, since many stocks were falling then. The next time I saw OSIM, it was trading at 6¢, where it was near its all-time low. If you think that I was rejoicing at the once-in-a-lifetime opportunity to load up heavily on OSIM, you guessed it wrongly. The thought then was "Luckily I didn't buy OSIM at $0.60!". Because if I had bought it at $0.60, I would be facing a 90% loss within barely a year of buying it. 

I did thought of buying it at 6¢, and even considered the execution costs and risks of it, but eventually did not do so. Sometimes, when we imagine buying a particular stock at a certain price, we always assume that we could get all we want at the desired price. The truth can be quite different. At that time, the bid-ask spread was not 0.1¢ as it is now. Then, the bid-ask spread was 0.5¢, i.e. buyer bidding for 5.5¢ and seller asking for 6¢. The spread by itself already constitutes 8% in execution cost should you buy directly from the seller. Not only that, liquidity dried up during that difficult period. My investment (if I had bought) would be around $5,000, or 80,000 shares. I suspect that these 80,000 shares could not be filled with a single order. Some might be filled on the following day or even at 6.5¢ if I was really impatient. At 6.5¢, that is another 8% in execution cost. In total, the execution cost/ risk can go up to a significant 17%. With an investment of $5,000, that can mean between getting 90,000 shares (if bought at 5.5¢) or 76,000 shares (if bought at 6.5¢). It can make a huge difference in the eventual profit that you could make from OSIM. You could see similar trading difficulties in some of the stocks in today's environment, such as MTQ.

Although OSIM is the biggest multi-bagger to be had during GFC, it is by no means the only multi-bagger available. Around the same time as I saw OSIM at 6¢, I was seriously deciding between buying Valuetronics at 7.5¢ or Hongwei at 12.5¢, eventually choosing Hongwei over Valuetronics. Had you bought Valuetronics at 7.5¢ during the GFC and held to its all-time high at $0.585 in Jul last year, you would have reaped a 7-bagger. While it pales in comparison to the 58-bagger of OSIM, it is still a very profitable transaction. In fact, a lot of investors did very well post-GFC despite not having bought OSIM.

Buying (or not buying) OSIM at 6¢ is still not the end of the story. There is still the recovery side of the story. The next time I saw OSIM, it had recovered to $0.23. Did I regret not buying OSIM at 6¢ at that time? Yes, I did. But I probably would have sold most of it at $0.23 had I bought it at 6¢. At $0.23, that is almost a 4-bagger. Considering that OSIM was losing a lot of money then (it lost $0.18 per share in 2008), I would be happy to sell most of it at $0.23, just in case it came back down again. As the price continued to climb, I would probably continue to sell it, with the last lot at $0.60 for a 10-bagger, exactly the price that I initially thought of buying it.

Putting everything in perspective, although not buying OSIM at 6¢ was regrettable, the regret pales significantly in comparison to the pain of selling most of OSIM at $0.23 and watching it climb all the way till $2.90! This is why whenever I recount the events of GFC, I would regret not having invested more in the stock market then, but I have not regretted not buying OSIM at 6¢.

In conclusion, it is easy to say "buy OSIM at 6¢ during GFC". But there are a lot more considerations to executing such a buy decision. Even so, not buying OSIM at 6¢ might not be such a bad thing. Most importantly, you do not need to buy OSIM at 6¢ to be successful in investing.


See related blog posts:

Saturday, 31 October 2015

Does Oxley's 5% Bond Have Sufficient Margin of Safety?

Bonds are typically boring investment with very little news. However, for the past week, it seems that the market could not get enough of news about bonds. First, there was the start of trading of Perennial's 4.65% bond on the SGX. Next, the second tranche of Singapore Savings Bonds closed with barely more than 20% of the total amount subscribed. Following that, OCBC announced that it would be redeeming its 4.2% preference shares listed on the SGX. Finally, we also have Oxley launching its 4-year, 5% bonds for subscription. Does Oxley's 5% bond have sufficient margin of safety according Benjamin Graham's criteria of minimum earnings coverage and minimum stock value ratio as described in The Lost Art of Bond Investment? Below are the ratios computed based on Oxley's latest financial statements in Jun 2015.

Earnings Coverage

Profit before tax = $142.7M
Adjusted for:
- Add: Non-recurring loss (forex, revaluation, impairment) = $23.3M
- Add: Finance cost = $41.0M
Total earnings available for covering fixed charges = $207.0M


Current finance cost = $41.0M
Add: Interest of proposed bond = 5.00% x $125.0M

= $6.25M
Total finance cost = $47.3M


Earnings Coverage = $207.0M / $47.3M

= 4.38

The earnings coverage of 4.38 times is above the minimum average earnings coverage of 3 times for industrial companies.

Stock Value Ratio

No. of shares = 2,9448.2M
Share price = $0.42
Market value of shares = $1,238.3M


Current amount of borrowings = $2,406.0M
- Add: Loan advances = $81.9M
- Add: Proposed bond size = $125.0M
Total bond value = $2,612.9M


Stock value ratio = $1,238.3M / $2,612.9M

= 0.474

The stock value ratio of 0.474 is lower than the minimum stock value ratio of 1 for industrial companies.

Thus, Oxley's bond meets the earnings coverage criterion but does not meet the stock value ratio criterion. Based on Benjamin Graham's criteria, Oxley's 4-year, 5% bond does not have sufficient margin of safety. Having said that, this does not mean that Oxley will definitely default on this bond, it just means that the risk is higher.


Sunday, 25 October 2015

The Day US Entered The Gulf War

It is the time of the year again as the world awaits US Federal Reserve (Fed)'s decision on Wed whether to raise interest rates. Although the majority view is that Fed would not raise interest rates at this meeting, the consensus was not so clear this time last month. I was busy wondering whether the economic implications of an interest rate rise would hold (i.e. stocks would fall) or the investor psychology of buying after a bad news would happen (i.e. stocks would rise). You can refer to A Jittery September for the thinking going on prior to the last Fed meeting. In the end, an event that happened 25 years ago settled the argument in favour of the latter.

It was 2 Aug 1990. Iraq had just invaded Kuwait, its oil-rich neighbour to the south. Oil prices promptly shot up from US$17 per barrel in Jul until it reached US$36 per barrel in Oct. Stocks fell correspondingly. The Straits Times Index (STI) fell from 1,557.80 points the day before the invasion and reached a low of 1,079.50 in mid Oct, for a loss of 31% in a short span of 2.5 months. Iraq had just emerged battle-hardened from an 8-year war with Iran and boasted an army of 1 million men with 5,000 tanks. It was the fourth largest army in the world. Throughout the second half of the year, people were worried about US going into a prolonged war with Iraq, with dire consequences for oil prices and the world economy. 

On 15 Jan 1991, US declared war on Iraq, codenamed as Operation Desert Storm. 2 days later, the war that people feared started with aerial assaults on Iraq. Yet, contrary to all expectations, stocks did not fall. Instead, they rose. STI rose 5.4% on the very day the war started. It was not an initial, knee-jerk reaction; stocks continued to rise until US ground troops liberated Kuwait and ended the war 6 weeks later on 28 Feb 1991. By the time the war ended, stocks had recovered almost to their initial levels prior to the war. The figure below shows the performance of STI during the period of the war.

STI Performance During Gulf War

If you had watched the 1992 Hong Kong drama "The Greed of Man" (“大时代”) starring Lau Ching Wan and Amy Kwok, this was the event that gave rise to the climax turnaround in fortune for the male protagonist.

Coming back to our time, on the one hand, my mind tells me about the economic implications of an interest rate rise, as described in Getting Ready for US Interest Rate Rises. On the other hand, my gut feel tells me that expectations for a fall in stock prices in the event of an interest rate rise had been heavily priced in and a counter-intuitive rally in stocks was possible. After recalling the above-mentioned event just before the Fed meeting in Sep, I decided to buy stocks in favour of an interest rate rise. As you know, the interest rate rise did not happen. Nevertheless, it resolved the last major consideration in deciding whether the "big bad bear" was coming. I thought I had another one month until the next Fed meeting in Oct to continue adding stocks slowly, but stocks went up unexpectedly in early Oct, thus ending my buying spree a little too early.

So, now, the world awaits Fed's decision again. Would the announcement of an interest rate rise (assuming it happens) set off a decline in regional currencies, gold, oil and stocks, or would it spark off a short-term rise in the very assets that are affected by interest rate rises, until the economic implications start to take effect in the medium-term? I am quietly believing in the latter. Having said the above, the recent stock rally has ended any further buying activity. Essentially, I do not buy stocks because I think they are rising; I buy stocks because I think they are undervalued, and at no risk of falling significantly. And in case I am wrong, there is still a warchest to rely on.


Sunday, 18 October 2015

Does Perennial's 4.65% Bond Have Sufficient Margin of Safety?

It has been getting more interesting for retail bond investors recently, with the launch of Aspial's 5.25% bond in Aug, Singapore Savings Bonds in Sep and now Perennial's 4.65% bond. Does Perennial's 3-year, 4.65% bond have sufficient margin of safety according to Benjamin Graham's criteria of minimum earnings coverage and minimum stock value ratio as described in The Lost Art of Bond Investment?

Perennial was listed following the reverse takeover of St James Holdings in Oct 2014. Hence, it did not have financial statement for a full financial year. Based on Perennial's latest financial statement for the year ended Jun 2015, the minimum earnings coverage and minimum stock value ratio are computed as follow.

Earnings Coverage

Profit before tax = $57.1M
Adjusted for:
- Deduct: Non-recurring fair value gain on investment properties = $46.0M
- Deduct: Other non-recurring gains (earn-out, forex) = $11.0M
- Deduct: Share of results of associates = $13.8M
- Add: Finance cost = $37.8M
Total earnings available for covering fixed charges = $24.1M


Current finance cost = $37.8M
Add: Interest of proposed bond = 4.65% x $150.0M

= $7.0M
Total finance cost = $44.8M


Earnings Coverage = $24.1M / $44.8M

= 0.54

The earnings coverage of 0.54 times is way below the minimum average earnings coverage of 3 times for industrial companies.

Stock Value Ratio

No. of shares = 1,652.5M
Share price = $0.975
Market value of shares = $1,611.2M


Current amount of borrowings = $1,678.5M
- Add: Proposed bond size = $150.0M
Total bond value = $1,828.5M


Stock value ratio = $1,611.2M / $1,828.5M

= 0.881

The stock value ratio of 0.881 is lower than the minimum stock value ratio of 1 for industrial companies.

Thus, Perennial's bond does not meet both the earnings coverage criterion as well as the stock value ratio criterion. Based on Benjamin Graham's criteria, Perennial's 3-year, 4.65% bond does not have sufficient margin of safety. Having said that, this does not mean that Perennial will definitely default on this bond, it just means that the risk is higher.


Sunday, 11 October 2015

A Jittery September

It looks like the recent "bear" market is over before it has barely begun! Having said that, September was a very jittery month for me, not because stocks had fallen rapidly, but because I was trying to figure out whether and when to buy stocks. Stocks had already fallen sharply in mid August when China devalued its currency, but a look at the calendar for September showed there were several more events that could cause nervous moments for the stock market, with Singapore's General Election (GE) on 11 Sep, US Federal Reserve's interest rate decision on 17 Sep and finally Greece's GE on 20 Sep. Including the renminbi devaluation and US' announcement of higher GDP growth in Q2 in August, there were 5 events to digest in quick succession in order to conclude whether the "bear" was coming or just pretending.

Among these 5 events, 3 have economic significance, meaning they have an impact on the economics of companies and how stocks are likely perform in the medium term. These events help to determine whether stocks should be bought or sold. The other events merely affect the volatility of the stock market, meaning they only determine the timing of any buying or selling decision. The 3 events that have economic significance were China's renminbi devaluation, US higher Q2 GDP growth and US Fed interest rate decision. The events that have volatility implication were Singapore's GE, Greece's GE and, again, US Fed interest rate decision. Let us consider the events with economic significance first.

The reason why China's renminbi devaluation sparked off a global stock market sell-off was because it suggested that China's slowdown was larger than expected. In the absence of any other economic news, this is going to be very dismal for the stock market for months, because every month, there are economic statistics coming out of China and you could expect most of them to be negative. On the other hand, US announced a positive set of GDP growth rates for Q2, which were much higher than that for Q1. The big question is this: Is the world's No. 1 economy going to pull up the world's No. 2 economy (and the rest of the world), or is the world's No. 2 economy going to drag down the world's No. 1 economy (and the rest of the world)? It is easier to answer the second question first, so let me start with that one. Nevertheless, I have to admit that economics is one of my weaker subjects and I do not profess that my answers are correct.

To answer the second question, it is worthwhile to consider the answer to another related question: did China pull up US in the first place? Because if China did not pull up US significantly in the first place, then it is unlikely to drag down US significantly in the near future. As an example, the fate of resource-exporting economies such as Australia is very much tied to that of China. When China boomed or slowed, so did these economies. Unlike resource-exporting economies, the main source of US growth was not China. A look at the US GDP Q2 report revealed that the main source of growth was domestic. Hence, it would take more than China's slowdown to knock the wind out of US growth. Now, back to the first question, would US pull up China, the world's factory, with its domestic demand? There are several reasons for China's slowdown, such as over-capacity and over-leverage, etc. Such issues take time to work through, so it will take a lot more than US demand to pull up China. Thus, the conclusion is that neither China would drag down US nor US would pull up China in any significant manner. The world's No. 1 and No. 2 economies will go about their separate ways in the near future. The other economies will be in-between these 2 economies depending on the relative exposure they have to each of them. The key conclusion is this: the world is not going into a synchronised global recession.

By the time I figured the above out, it was early Sep. Sentiments were very fragile then. While I did not mind buying, say, Keppel Corp at the $6.80 price range, I mind a lot if it were to drop $0.30 the day after I bought it. It was not improbable for Keppel Corp to rise or fall by $0.30 in a single day during those days. So, I decided to wait until Singapore's GE was over. Surprisingly, stocks did not move much the following Monday after the GE, despite a landslide win for the governing party. That week was also the week of the Fed meeting and Grecee's GE. Let's talk about Greece's GE first. The key issue about it was whether there would be a replay of the Grexit drama in July, when Greece nearly exited the Euro zone because of opposition to austerity measures imposed by the EU as conditions for bailing out its debts. I managed to figure out beforehand that neither the anti-austerity governing party nor the pro-EU opposition party would oppose the debt bailout package, so Greece's GE was not a key event to consider. The final event left was Fed's interest rate decision on 17 Sep.

US Fed interest rate decision has both economic significance and volatility implications. The economic significance was discussed in Getting Ready for US Interest Rate Rises in Jun. To recap the key points from that discussion, interest rates are not going to rise significantly. However, regional currencies and US dollar-denominated assets like gold, oil and other commodities are in for a rough ride. Volatility in these assets will likely lead to volatility for the stock market. This conclusion is based on economic considerations. However, given the fact that interest rate rises have been discussed for a very long time already, I have a gut feeling that expectations for a drop in regional currencies and USD-denominated assets have been priced in already. There is a possibility of a counter-intuitive rally in the very assets that are supposed to fall when Fed announces a rise in interest rates!

To summarise, these are my conclusion of the key events of the past month that determine whether and when to buy stocks:
  • US vs China: The world is not going into a synchronised global recession
  • US Fed interest rate decision: Economically negative for regional currencies and USD-denominated assets, but possibility for a counter-intuitive rally in the same assets
  • Singapore's GE: Turned out to be a landslide win for the governing party
  • Greece's GE: No replay of Grexit

My key conclusion is that the "big bad bear" is not coming and I began to pick up stocks. Nevertheless, I remain wary of stocks with exposure to regional currencies and my warchest is still intact should my analysis be wrong and the bear returns.


See related blog posts:

Sunday, 4 October 2015

The Big Picture During Bear Markets

Bear markets can be very frightening. They can cause stocks to drop by 40% to 60% and stay there for a fairly long period of time. It can be quite stressful to go through a bear market, especially for young investors. However, it is helpful to look at the big picture, which is this: even though the prevailing bear market might look very frightening, most young investors are still working, and there are 20 to 30 years of income still to be earned. If you include these unearned income in your total wealth, you will find that the prevailing bear market actually only eats up a small fraction of your total wealth. Let us consider the following example.

Starting Salary  $      3,000
Annual Salary Growth 5%
Salary Ceiling  $    10,000
Investment Allocation 10%
Asset Returns 7%
Max. Drawdown 50%

A fresh graduate aged 25 is able to earn a starting salary of $3,000 per month. This salary grows at a rate of 5% annually. Let's further assume that his salary does not grow forever, and his salary ceiling is $10,000 per month. He is able to set aside 10% of his monthly salary for investment, which grows at a long-term average rate of 7% per year. During a bear market, he loses up to 50% of his invested capital in unrealised losses, which can be quite painful for a young investor.

At the age of 30, 5 years after working, he would have accumulated an investment capital of $22,729, comprising the $300 he set aside every month which grows at the long-term average rate of 7% per year. At the depth of the bear market, he would have lost 50% or $11,364 of his investment capital that he has so painstakingly built up over the last 5 years. Although the losses are significant, he still has 35 years of working life in front of him. Assuming that he continues to set aside 10% of his future monthly salary for investment, he would have an unearned present-value capital of $100,457 (discounted using the 7% long-term annualised asset return), or 4.4 times his earned capital. The unrealised losses just make up 9% of his total wealth, which is a lot more comfortable than the 50% unrealised losses. The figure below shows the amount of earned capital and unearned capital at age of 30, 35, 40 and 45 for the same person.

Total Capital for Different Age Group

As the person increases in age, his unearned capital will reduce as it is progressively transformed into earned capital. At age 35, the unearned capital is still 65% of his total capital, which is equivalent to 1.8 times of his earned capital. The unrealised losses just make up 17% of his total wealth. At age 40, the unearned capital is 50% of his total capital and the unrealised losses make up 25% of the total wealth. Only after the age of 40 would the unearned capital fall below 50% of the total capital and the unrealised losses make up a significant portion of the total wealth. By this time, he would need to take less risk to reduce the amount of potential losses.

The point is, if you are a young investor, the prevailing bear market might look very frightening as you sustain heavy losses in percentage terms. However, if you consider the big picture of future cashflows, the amount of unrealised losses is considerably smaller. I would even say that a few years after you have gone through this difficult period and accumulated more capital, you might look back at this period and realised that the "signficant" unrealised losses that caused so much pain is actually fairly insignificant. As an example, at the depth of the 2000-2003 bear market, my unrealised losses were $50,000, which was equivalent to 50% of my invested capital. It was a very significant loss and very depressing. But by the time I got to the depth of the Global Financial Crisis (GFC) 5 years later, the amount of unrealised loss was around $175,000 to $200,000. The $50,000 unrealised loss sustained during the 2000-2003 bear market that seemed so significant then had paled in comparison. You might not believe me now as you go through his difficult period, but in a few years' time, you will realise that this is true. What is important now is not how much money you have lost, but how many lessons have you gained in investing, so that in a few years' time, as your investment capital grows, you will not make similar mistakes again, which are going to cost you a lot more since your investment capital has increased.


See related blog posts:

Sunday, 27 September 2015

Different Types of Bears

Whenever we speak of a bear market, we tend to think that there is only 1 type of bear markets and all bear markets are the same. However, I can think of 2 different types of bear markets (shortened to "bear" hereinafter); the first one is similar to the market downturn that we experienced recently which is fast and sharp. Let's call it the ferocious bear. Examples of the ferocious bear would be the Asian Financial Crisis in 1997/1998 and the Global Financial Crisis in 2008/2009. The second type of bears is gradual but long-winded. Let's call it the long-winded bear. An example of the long-winded bear would be the one that lasted from 2000 till 2003. The figure below shows both types of bears as happened to the Straits Times Index (STI). You should be able to recognise the bears easily.

Bears on STI

What are the characteristics of both types of bears? For the ferocious bear, the decline is both fast and furious. The speed and fury of the bear usually strikes fear into most investors who are more accustomed to peaceful environments. The losses are usually very severe and come quickly. As the bear progresses, you might think that prices have declined significantly enough, but each time you average down, the losses of the newly invested capital are just as severe. You hope the bear would stop for a while so that you could have some respite. But no, the bear would not listen to anyone and continue its forage, slashing anyone who dares to stand in its path. Not everyone would be able to take it. Some investors would sell out with heavy losses, promising never to return to the stock market. Other investors would continue to do battle with the bear despite heavy bleeding. At the depth of the bear, investors would still wonder if things are going to get worse and doubt any recovery as another bear trap. It is a very fearful atmosphere to be in. However, as quickly as the bear advances, the ferocious bear will just as quickly retreat away. Investors who have the mental strength, intelligence and money to buy during the depth of the ferocious bear will usually make a lot of money. On the other hand, investors who are not accustomed to deal with the bear will lose money.

For the long-winded bear, the decline is more gradual but long. Using the last long-winded bear that lasted from 2000 to 2003 as an example, it is actually made up of a sequence of unfortunate events. It started off as the dot-com bust in 2000, followed by the Sep 11 terrorist attack in 2001, US accounting scandals in 2002 and the Severe Acute Respiratory Syndrome (SARS) in Asia in 2003. The losses are severe, but smaller and not as quick as those encountered during the ferocious bear. Attempts to average down usually result in losses but these losses are less severe and easier to stomach. Every day, week or month that you look at your portfolio, you would see fairly severe losses and you would wonder when is there going to be light at the end of the tunnel. It can be very depressing to be mired in heavy losses for a long period of time, but the atmosphere is not one of fear.

How do you manage the 2 different types of bears? Let's start with the easier one, the long-winded bear. Dealing with the long-winded bear is like running a marathon. If you do not finish the race, it is usually because you lack the endurance and drop out half-way. However, if you could persevere and outlast the long-winded bear, you will usually recoup all the losses and make money.

On the other hand, dealing with the ferocious bear needs some skills and luck. It is like running a 110m hurdle dash. Although it is not as long as running a marathon, if you happen to trip over a hurdle, you would not finish the race. Why do I say that? It is because most bears have an economic side to them. As the financial bear is ravaging the financial markets, the economic bear is also damaging the real economy. Not every company will survive the economic bear unscathed. With a long-winded bear, the economic effects are gradual but long-winded. Companies can tighten their belts to tide through the difficult period. But with a ferocious bear, the economic effects are fast and furious. Companies that cannot adjust quickly to the new economic realities will be in trouble. If you happen to invest in weak companies during the ferocious bear, you might not make much money even as the ferocious bear retreats away.

To illustrate further the effects of the 2 types of bears, consider 2 sectors – Property and Oil & Gas (O&G). As you know, property prices in Singapore have been in the doldrums since the Government enacted several property cooling measures several years ago. However, they are not in a sharp decline. Property is considered to be in a long-winded bear. Despite the weak sentiments, you do not expect property developers to be in serious trouble, even though some of them might lose money as the bear progresses. They just need to tighten their belts and hold on until sentiments improve (Note: I am not a long-term fan of properties. See Properties, the Population White Paper and the Land Use Plan for the reasons).

On the other hand, oil prices have been in a fast and drastic decline. O&G is considered to be in a ferocious bear. Not all O&G companies will escape unscathed. Already, some of the O&G companies had to carry out right issues at low prices to raise additional capital. It is thus important to pick the right stocks in a ferocious bear in order to gain from it.

It is not possible to simply say everyone can survive the bears and make a lot of money. Without experiencing it yourself, you will not be able to appreciate the fearfulness of the ferocious bear or the depressiveness of the long-winded bear. However, if you are like most people working and able to set aside some money for investment every month, you actually have the conditions to outlast and profit from the long-winded bear. And if you have been investing for some time and know the value of not investing 100% of your money and keeping some of them in a warchest for subsequent use, you too have the necessary (but insufficient) conditions to outlive the ferocious bear.

Having said the above, not everyone will be able to take the fearfulness or the depressiveness of the 2 types of bears. You need to evaluate for yourself if you are cut out to be an active investor. If you cannot be an active investor, you still can become a passive investor. If you read the above paragraph carefully, "able to set aside some money for investment every month" is akin to Dollar Cost Averaging (DCA) that is normally associated with passive investing. And "not investing 100% of your money and keeping some of them in a warchest for subsequent use" is akin to portfolio rebalancing, which is also a passive investing strategy. The final "necessary (but insufficient) conditions to outlive the ferocious bear" is to invest in an index rather than to pick stocks. While individual companies might not recover, the industry as a whole (or economy) will not fail. Investing in indices is at the core of passive investing. So you see, although passive investing strategies might look dumb and boring, they are actually designed to survive bears! DCA is designed to deal with long-winded bears especially while portfolio rebalancing is designed to deal with ferocious bears in particular (together with index investing)! They have probably been around for as long as bears have existed, and the fact that they have not been sent into extinction by the bears is further proof that they work!

I hope with this blog post, it will help to settle some nerves in the current stock market downturn (I prefer not to rate it as a bear yet). Good luck!


See related blog posts: