Saturday, 30 March 2013

Properties, the Population White Paper and the Land Use Plan

In an earlier post on Properties, I mentioned that it was not ideal to hold properties in Singapore in the long run, mainly because of the rapidly ageing population demographics. In that analysis, I had omitted the effects of migration and new housing supply, which could not be forecast with any certainty then. With the release of the Population White Paper and the Land Use Plan, we now have greater clarity in the migration numbers and new housing supply. How would the analysis change when these factors are included? Let us recap these numbers first.

Migration
In the Population White Paper, it was mentioned that the number of new citizens would increase by between 15,000 and 25,000 a year. As for the Permanent Resident (PR) population, it will remain stable at between 0.5 and 0.6 million and forms a pool for potential new citizens. Hence, any increase in the PR population will eventually show up as an increase in the citizen population and can be omitted. The annual increase in the resident (citizen + PR) population will therefore be between 15,000 and 25,000. For simplicity, let us assume an average figure of 20,000 new residents per year. As for the non-resident population (e.g. employment pass and work permit holders), they can be excluded as they are more likely to rent than buy properties.

New Housing Supply
In the Land Use Plan, it was mentioned that there will be another 700,000 new houses, increasing the total number of houses from 1.2 million to 1.9 million by 2030. Of these, 200,000 new houses will be ready by 2016. From 2017 till 2030, it is assumed that the new housing supply will be evenly distributed, i.e. 35,700 per year. Based on past trends, each house will be able to accommodate 3 persons.

Analysis: Base Population Only
To recap, Figure 1 below shows the population projections excluding migration and new housing supply based on the population figures in Jun 2011. (Please see the earlier post on Properties for how the population projections are derived). Based on these figures, the ratio of potential buyers/ upgraders to potential sellers/ downgraders (i.e. all buyers/ sellers) will cross parity in 2025.

Figure 1: Population Projections Based on Base Population


Analysis: Base Population + Migration
If we include migration at 20,000 per year (or 100,000 per 5-year period) and distribute them in proportion of 40%, 40% and 20% in the age groups of 25 - 29, 30 - 34 and 35 - 39 respectively, the population projections can be seen in Figure 2 below. The year that the ratio of all buyers to sellers will cross parity will increase from 2025 to 2029.

Figure 2: Population Projections Based on Base Population + Migration


Analysis: Base Population + Migration + New Housing Supply
If we now include new housing supply in the analysis, the population projections are shown in Figure 3 below. The year that the ratio will cross parity will change from 2025 (base population) to 2029 (base population + migration) to 2020 (base population + migration + new housing).

Figure 3: Population Projections Based on Base Population + Migration + New Housing Supply


Overall Analysis
If we compare the ratio of all buyers to sellers for the 3 scenarios mentioned above, the effects of migration and new housing supply can be seen in the figure below.

Figure 4: Ratio of All Buyers/ Sellers for the 3 Scenarios

As shown in Figure 4, migration will increase the ratio of all buyers to sellers and delay the year the ratio crosses parity. On the other hand, new housing supply will decrease the ratio and bring forward the year the ratio crosses parity.

It should be noted that the sharp drop in the ratio due to new housing supply in 2016 and 2021 should not cause too much alarm, as any housing demand has to be met by the existing housing stock and/or new housing supply.

In conclusion, regardless of which scenario we look at, the general trend is clear: sellers will eventually outnumber buyers even if we consider migration. Property investors are facing a significant headwind from demographics in the long run.


See related blog posts:

Saturday, 29 September 2012

Shareholding Disclosure

In stock recommendation reports, the stock analyst has to declare his shareholding in the recommended stocks. When he declares that he holds certain stocks, do you then treat his stock recommendations with some suspicion, wondering whether he is recommending certain stocks so that the rest of the public would buy and lead to a rise in the stocks that he holds? And if 2 stock analysts (Analysts A & B) both recommend the same stock but Analyst A doesn't hold any shares in the stock and Analyst B does, who would you believe in more? Most people would believe in Analyst A more, because he has no vested interest in his recommendations. However, should that be the case?

Analyst B puts his money where his mouth is. If the stock drops, at least he suffers a loss together with his clients. And when he is prepared to put his money in, he would be more careful in analysing the stock being recommended. If the stock drops, he would learnt where has he made a mistake in his stock analysis and would review the stock more regularly for any changes in prospects. For as long as he holds the stock, he has the same interest as his clients. In contrast, Analyst A neither gain or lose regardless of how the stock performs in future. He may have no vested interest, but that also means less alignment to the interests of his clients. While one might argue that a wrong stock recommendation would lead to clients not believing in him in future, this is rarely the case as investors generally do not track the performance of stock analysts. Stock recommendations are essentially an opportunity for investors to trade the stock short-term. Hence, for long-term investors, isn't it important that they consider whether the analyst holds the stock in the mid- to long-term?

As an analogy, imagine that you wish to travel to an exotic destination for a holiday. 2 travel agents (Travel Agents A & B) offer their travel packages to you, but Travel Agent A has never travelled there and will not be accompanying you on this trip. On the other hand, Travel Agent B has travelled there and will be on the same trip as you. Which travel agent would you sign up with? More likely Travel Agent B, because of his experience and his presence on the same trip. If this is the case, shouldn't investors believe in Analyst B more when it comes to stock recommendations? This is one of the paradoxes in stock investing.

Different Tastes for Different Folks

We sometimes look towards people who are successful in investing and hope to emulate their success. By following their investment strategies, we should be more successful in our own investments, won't it? And by following more such successful investors, we should have a greater chance of success in investing, isn't it? However, even after following their investment strategies, we sometimes wonder why we are not as successful as they are.

There are many investment strategies that make money, like value investing, growth investing or technical analysis. However, the stock market sometimes has a fad. Occasionally, it would favour under-valued stocks while at other times, it would favour growth stocks. When the investment strategy that we adopt does not yield us the desired effects, we would generally lose faith with it. Conversely, we see other investors making loads of money and try to adopt their investment strategy and abandon our own strategy. Even so, we do not consistently make money.

It's important to be patient. Every sound investment strategy would make money if you are patient enough. Even the greatest investors do not constantly make money at all times. Take for example, Warren Buffet, the greatest investor, did not make money during the dot-com boom when everyone else was making money off internet stocks. However, just because the investment strategy is currently out of favour with the stock market does not mean that it is a poor strategy. And when you switch to a strategy that is currently in favour, you risk riding on the tail-end of that strategy and the winds might just be about to turn. Moreover, by switching strategy, you lose focus in your investment strategy.

Investment strategies are like cuisines. All cuisine are tasty, but sometimes, for example, French cuisine are more popular while at other times, Italian cuisine are in favour. While we learn to be a better French or Italian chef, we should not mix the 2 cuisines. Doing so would be rojak, and we never get to be a fine French or Italian chef.


See related blog posts:

Know Yourself

In our conversations with people, we sometimes would come across a conversation in which someone said that he should have bought stocks when the market was at a certain (low) level or sold when it was at a certain (high) level? Well, why didn't he do it? It must be because he didn't know what to do when the market was at that level.

One of the reasons why I am such a boring investor is because I could never give an opinion whether the stock market would go up or down in the next couple of months in conversations. While I do not know whether the stock market would go up or down, I make up for this deficiency by knowing what I should do whether the stock market is up or down. When you know what you should do under all scenarios, it becomes less important to predict the future or worry about it. Take for example the weather. Do we constantly worry in bed whether the next morning would be sunny or rainy? No. Partly, it's because the weather tomorrow do not have much consequences for us city-dwellers. But partly, it's also because we know what to do whether it's sunny or rainy. When it's raining, just carry an umbrella! By knowing what we should do, we do not need to predict or worry so much. Whether the stock market would go up or down is outside our circle of knowledge and influence, but what we should do whether the stock market is up or down is within our circle of knowledge. Use our circle of knowledge to manage those events that are outside of it.

So, how do we know what we need to do whether the stock market is going up or down? It is to have a plan, which guides you what to do under different market conditions. See my earlier post on Have a Plan for more details.


See related blog posts:

Monday, 24 September 2012

Have a Plan

Nobody can predict the movement of the stock market with any certainty. Moreover, emotions often come into play which can significantly affect the rational judgement of investors. When the market is good, most investors are caught up in the euphoria and think that the market will go higher. Their recent past actions to sell turn out to be wrong and the market continues to go higher after they have sold their shares. Slowly, they begin to hold on to their shares longer and might buy even more when the market dips. Eventually, the market runs out of steam and turns into a bear market, generating paper losses for investors who bought when the market was peaking. At the other extreme, when the market is bad, most investors would become disillusioned and unload their shares at a loss. These 2 examples illustrate why the power of emotions in affecting investing outcomes should not be underestimated. If they could be controlled in some ways, it will go a long way towards being successful in investing.

One way to control emotions is to have a plan. This plan is created away from the influence of the market and dictates what investors should do in different market conditions. By following this plan strictly, one can remove the influence of emotions and make more rational decisions in the thick of market action. Without this plan, it is akin to sailing in the seas without a map.

It is easy to create a plan. One of my first basic plan was to tie the level of stock allocation to the stock market index inversely. When the index is high, the level of stock allocation would be lower. Conversely, when the index is low, the level of stock allocation would be higher. By following this plan strictly, it forces me to buy shares when the index is low and sell shares when the index is high. Of course, following this plan almost always results in the stock market going lower when I'm buying shares and going higher when I'm selling shares. However, through this plan, I'm able to make the correct decisions of buying low and selling high without the influence of emotions. Moreover, it is difficult to predict when is the market peak and trough. What this plan advises is to buy when the market is low enough and sell when the market is high enough.

The plan that you create for yourself must suit your own investment objectives and risk preferences. It is not good enough to adopt a plan that works for others. As this plan is needed to guide you through all market conditions, you must be comfortable with what the plan recommends. Otherwise, you would not be following the plan and it would defeat the purpose of creating the plan. Consider all possible market conditions and review if the recommendations are appropriate based on your investment objectives and risk preferences. If they are not suitable, make adjustments until you are comfortable with them. Once the plan is created, you may review and adjust periodically, but not when the market is going through a prolonged bull or bear market which might cloud your rational thinking. After all, the purpose of the plan is to guide you through such extreme market conditions.

Having created a plan that is suitable for you under all market conditions, it is alright if you wish to deviate from it slightly, based on your assessment of the prevailing market conditions. After all, the plan is rigid and does not take into account other factors that might influence the direction of the market. This is known as a tactical allocation while the plan that you created sets the strategic allocation. So long as you do not deviate far away from the plan, the impact of such deviation should be minimal.

As a piece of caution, by following this plan strictly, it takes the fun out of investing. So, now you know why trading shares might be exciting, but it's usually the boring stuffs that make money?


See related blog posts:

Sunday, 23 September 2012

Properties

Properties are the favourite investment class in land-scarce Singapore. Many people have heard and seen for themselves how a flat that cost their parents a few thousand dollars in 1960s could rise to hundreds of thousand dollars currently. The conventional wisdom is that land is scarce in Singapore, therefore, property prices has only one way to go, which is up.

I'm not a property investor. However, I did researched about the prospects of property investment in the long-term 10 years ago, and my conclusion was that it was not ideal to hold on to properties past the year 2017. This point was shared in a letter to the Straits Times Forum Page in response to a Special Report titled “Can You Afford to Retire?” on 18 Dec 2004. Because of this research, I have avoided property investment and missed the great property boom experienced in the last couple of years. I'll share the findings here for discussion.

The primary reason for property investment not being an ideal investment in the long-term has to do with the population demographics of Singapore, which by now, everyone knows is ageing rapidly. Below are the population projections in Jun 2001, at the time of my research. The population projections in the subsequent years are obtained by shifting the 2001 population forward, i.e. the population aged 0 - 4 in 2001 would be aged 5 - 9 in 2006, 10 - 14 in 2011, so on and so forth. The birth rates in subsequent years are maintained at the prevailing levels.

Figure 1: Population Projections Based on 2001 Population Statistics

Let's assume that the house-buying population is aged 25 - 39, the upgrader population is aged 40 - 49, the downgrader population is aged 60 - 74 and the house-selling popuation is aged 75 and above. To simplify the analysis, let's further assume that there is no net migration and no new houses built. The ratio of potential buyers/ upgraders to potential sellers/ downgraders is a healthy 4.02 in 2001, which means that there are 4 potential buyers/ upgraders for every potential seller/ downgrader. This is a good time for holding property investments. However, this ratio decreases rapidly with time and crosses parity in the year 2020, making property investments less attractive in the long-term.

How would the ratios change if we consider net migration and new houses being built? The ratios would be more favourable with migration as there would be more buyers. On the other hand, the ratios would be less favourable with new houses built as there would be more sellers. It is unclear which of these factors would play a bigger role. Given the uncertainty of the impact of these factors and that they partially offset each other, we can leave them out of the analysis for now.

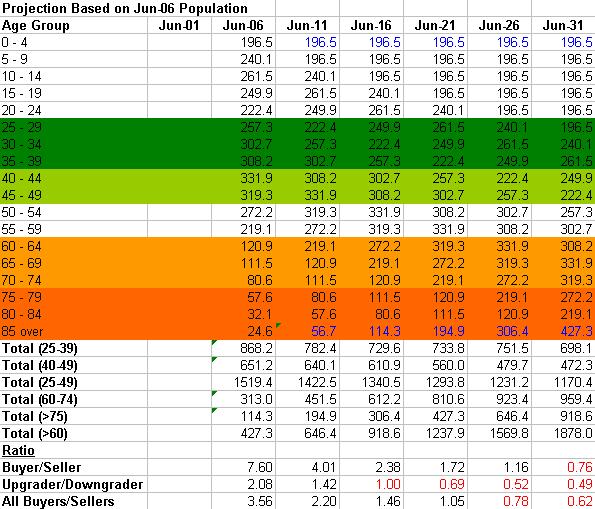
With the advantage of hindsight, we can review the same analysis using the population statistics in 2006 and 2011. The results are shown below.

Figure 2: Population Projections Based on 2006 Population Statistics

Figure 3: Population Projections Based on 2011 Population Statistics

As you can see, the ratios have improved, due to increased migration over the years. For all buyers/sellers, the year that the ratio will cross parity has increased from 2020 (based on 2001 population statistics) to 2022 (2006 statistics) to 2025 (2011 statistics). Nevertheless, the fact that sellers will eventually outnumber buyers remains unchanged. Property investors are facing a significant headwind from demographics in the long run.

To improve the situation, the demographics challenge needs to be improved, with more babies and/or migration. In addition, there should be a means to buy back houses from the elderly population who wishes to monetise their flats to fund their retirement. The lease buy-back scheme in which HDB buys back the tail-end of the lease is a good solution. Allowing residential real estate investment trusts (REITs) to be set up to buy-and-leaseback the flats to elderly (with safeguards) might be a feasible option too.

It is interesting to note that the old Chinese saying, "to raise children to guard against old age", is still as apt as ever in today's challenging demographics environment.


See related blog posts:

Wednesday, 19 September 2012

Government Bonds – The Tools

Now that you are equipped with the basic knowledge of trading SGS bonds, the next question to ask is when to buy or sell. To answer this question, you need to know the current yield relative to the historical range. A useful tool is to plot the cumulative distribution of the historical yields and the current yield. See the graph below.


The lines represent the cumulative distribution of the historical yields of all benchmark bonds while the triangles represent the current yield. Using the 3-month bill as an example, the average yield is about 1.5% historically while the current yield is less than 0.25%. As you can see, the current yields for practically all bonds are languishing at new historical lows except for the relatively new 30-year bonds. As bond prices move in opposite direction from interest rates, interest rates are likely to rise in the next few years and bond prices likely to drop (by a factor of Change in Interest Rate x Duration). Hence, significant potential losses exist for long-term bonds.

A second useful tool is to compare the spread between long-term and short-term bonds. Usually, a spread exists between these bonds, as longer-term bonds would need to offer higher yields to compensate investors for inflation in future. However, during certain periods, the spread could significantly widen or narrow beyond its usual range. This can give rise to potential trades in either long-term or short-term bonds. See the graph below.


In this graph, the blue line represents the yield of the shortest bill while the pink line represents the yield of the longest bond available (which could be the 15-year, 20-year or 30-year bond available at that time). The yellow line represents the spread between these 2 yields. As you can see, there is a range of between 1% and 3.5% in which the spread usually fluctuates. However, in Sep 2006, the spread was negative. A review of the long- and short-term yields reveal that this was a result of the short-term yield rising to meet the long-term yield. Such an anomaly is unlikely to continue for long and the strategy would be to bet that the short-term yield would decline to its usual range. Hence, the strategy would be to buy short-term bonds. Recall that the Change in Bond Price is approximately equal to Change in Interest Rate x Duration, you would want to pick the bond whose yield is as close to the short-term yield as possible while at the same time have as long duration as possible. This is actually a trade-off as the longer the duration (and maturity), the further away its yield will be from the short-term yield.

Consider another example in Jun 2008 when the spread reached the higher range of 3.5%. Here, the rise in spread was contributed both by a rise in long-term yield and a fall in short-term yield. Again, this high spread could not be sustained for long and either a fall in either long-term yield (which is profitable if you buy the bond) or a rise in short-term yield (which is loss-making if you buy the bond) or both would be likely. However, from the historical trend of long-term yields, the long-term yield at that time was not at the high-end of its range and it was possible that the long-term yield could move higher and result in a loss for bond holders. Similar, the short-term yield was at the low-end of its range and could potentially rebound. This transaction, while likely, is not a "sure" thing compared to the earlier example. As it turned out, the long-term yield fell while the short-term yield roughly held steady. Holders of long-term bonds would have made a profit.

The above are 2 useful tools for investment in SGS bonds. Hope they can assist you in investing in SGS bonds!


See related blog posts: