Showing posts with label Stocks. Show all posts

Sunday, 15 November 2020

Banks' Operating & Financial Metrics Explained

Recently, the 3 local banks reported a better set of results than expected. Banks have a unique set of operating and financial metrics that are different from other industries and their financial statements cannot be analysed based on the usual metrics. This blog post attempts to explain the various metrics used in banks' financial statements. I will use DBS' financial statements as examples for the metrics, but they are applicable to the other 2 banks.

Net Interest Income

At the core of a bank's operations is its business of taking short-term deposits and making long-term loans. Banks charge higher interest rates for the loans and pay lower interest rates for the deposits, thereby profiting from the difference in interest rates. This difference is known as the Net Interest Margin (NIM). The higher the NIM, the more profits the bank generates from its lending operations. In the last 6 months, the NIM of banks have come off steeply as the US Federal Reserve lowered interest rates sharply to stave off an impending recession caused by the COVID-19 pandemic. For DBS, its NIM has dropped from 1.86% in Dec 2019 to 1.53% in Sep 2020.

Many factors affect the NIM. One of them is the Loan-to-Deposit Ratio (LDR). This ratio indicates how much deposits are lent out as loans. The higher the LDR, the more loans are made from the deposits. However, it is never a good idea to lend out 100% of the deposits, because if depositors were to withdraw money from the bank at short notices, the bank would have to find other sources of funds to replace them. These alternative sources of funds are usually more expensive than customers' deposits. Due to the COVID-19 recession, depositors have flocked back to the safety of the 3 major banks. For DBS, its LDR has dropped from 89% in Dec 2019 to 83% in Sep 2020 as it receives more deposits than it could loan out.

Another factor is the Current Account Savings Account (CASA) Ratio. Banks obtain their funds from current accounts, savings accounts, fixed deposits, bank bonds, shareholder equity, etc. This ratio describes the percentage of deposits that are from current and savings accounts, which have the lowest cost of funds among all funding sources.Thus, the higher the CASA ratio, the lower the interest rate paid to depositors and the higher the NIM would be. For DBS, the CASA ratio went up from 58.9% in Dec 2019 to 69.5% in Sep 2020. This is likely due to the low interest rates offered on fixed deposits, which discourage depositors from renewing their fixed deposits. 

Credit Costs

Although banks profit from the Net Interest Income, there are also loans that might potentially go bad and have to be written off, which reduces the lending profits. The key metric is the Non-Performing Loan (NPL) Ratio. This ratio describes the percentage of loans that might potentially go bad. Note that this ratio reflects the total amount of outstanding NPLs at a snapshot in time and not new NPLs incurred during the reporting period. For DBS, the NPL ratio has largely stayed constant, from 1.5% in Dec 2019 to 1.6% in Sep 2020.

How banks deduct losses from bad loans is by setting aside allowances in the income statement. Note that these allowances do not necessarily mean that the bad loans are irrecoverable. If the economy recovers and the companies do well again, the bank could write-back the past allowances made, thereby increasing the profit in future reporting periods.

There are 2 types of allowances -- general provisions and specific provisions. General Provisions (GP) are for potential bad loans in the industry as a whole, while Specific Provisions (SP) are for bad loans of specific companies. For example, retailers are facing significant challenges from e-commerce and COVID-19. Banks might set aside more general provisions for loans to retailers. On the other hand, Robinsons' closure means that banks that are exposed to it have to set aside more specific provisions for loans to Robinsons.

In recent years, banks have adopted the Expected Credit Loss (ECL) model, which requires banks to estimate the expected amount of credit losses from the loans. There are 3 stages in the ECL model. ECL Stages 1 and 2 correspond to GP while ECL Stage 3 corresponds to SP.

For 3Q2020, DBS set aside $236M in GP and $318M in SP. As a percentage of total loans on an annualised basis, the SP credit cost is 0.31% or 31 basis points. The GP credit cost works out to be 23 basis points.

Thus, for 3Q2020, DBS made NIM of 1.53%, but had to set aside credit costs of 0.31% in SP and 0.23% in GP. After deducting the credit costs, DBS made 0.99% from its lending operations.

From another perspective, DBS' NPL ratio is 1.6%, which is close to the NIM of 1.53%. In other words, the Net Interest Income that DBS makes in 1 year is nearly sufficient to write off all the existing NPLs.

Allowance Reserves

The GP and SP set aside in each reporting period go to the allowance reserves. When the loan eventually cannot be recovered, the loan amount is deducted from the reserves. There is no further impact on the income statement.

There is another reserve known as Regulatory Loss Allowance Reserve (RLAR). Allowances for RLAR are set aside from retained earnings instead of from the income statement, i.e. profits are not reduced by the amount set aside for RLAR, unlike GP and SP. However, there is no free lunch. When the loan eventually cannot be recovered, the loan amount is deducted from RLAR and from the income statement.

Together, the GP and SP reserves and RLAR form a pool of allowance reserves to cover Non-Performing Assets (NPA). NPAs are similar to NPLs, but include other NPAs in the banks' non-lending businesses, such as wealth management, brokerage, etc.. The (Total Allowance & RLAR)/NPA Ratio indicates the percentage of NPAs which is covered by the total allowance reserves. For DBS, this ratio is 107% in Sep 2020, which means that all NPAs are fully covered by the reserves. If this ratio is less than 100% and if all NPAs were to be irrecoverable, any shortfall will have to be deducted from the income statement. If this results in a loss, it will reduce the bank's capital, which might affect the stability and liquidity of the bank (see next section). Thus, the total allowance reserves provide a cushion for bad loans before the income statement and bank's capital are impacted. Having said the above, there is no requirement for the ratio to be above 100%, since not all NPAs will end up being irrecoverable.

Some NPAs are secured by collaterals. For these loans, banks could take over and sell the collaterals to recover the loans. Hence, there is a corresponding ratio that considers only unsecured NPAs. This is the (Total Allowance & RLAR)/Unsecured NPA Ratio. For DBS, this ratio is 200% in Sep 2020, which means that the allowance reserves are sufficient to cover unsecured NPAs by 2 times. The high ratio helps to cushion instances whereby the collaterals are worth less than the loan amount.

Stability & Liquidity

Banks are systematically important to the economy and failure of a bank could lead to disastrous consequences. To guard against such scenarios, banks are required to have sufficient capital reserves to absorb loan losses. This is measured by Capital Adequacy Ratios (CAR). Capital can be classified as Tier 1 or Tier 2, with Tier 1 being more reliable than Tier 2. Tier 1 capital comprises share capital and audited retained earnings, while Tier 2 capital comprises unaudited retained earnings and general loss reserves. CARs are measured by dividing the specific tier of capital over Risk-Weighted Assets (RWA). Different types of loans have different risks (e.g. secured/ unsecured), and RWA considers the likelihood of the assets going bad.

The most important CAR is the Common Equity Tier 1 (CET1) Ratio. This ratio is most keenly watched by investors, as it has implications on the amount of dividends the bank can declare. If the CET1 ratio is too low for regulators' comfort, regulators could ask the bank to stop dividends so that earnings could be retained to build up the CET1 capital. Similarly, banks could also raise capital via rights issues.

In Sep 2020, DBS' CET1 ratio is 13.9%, which is above the bank's target ratio of 12.5% to 13.5%. For reference, the last time DBS carried out a rights issue was in Dec 2008, at the height of the Global Financial Crisis (GFC). Its Tier 1 CAR then was 10.1%. Post-issuance, the Tier 1 CAR rose to 12.5% in Mar 2009.

The GFC saw governments stepping in to rescue major banks that were at risks of failing. Since then, regulators have introduced 2 additional measures to ensure that banks would not fail again. The Liquidity Coverage Ratio (LCR) measures how much High Quality Liquid Assets the bank has to meet estimated total net cash outflows over a 30-day stress scenario. The Net Stable Funding Ratio (NSFR) measures the amount of available stable funding relative to the amount of required stable fuinding. The LCR and NSFR measure the short-term and mid/long-term resilience of the banks respectively and must be above 100%. For DBS, the LCR and NSFR are 135% and 123% respectively in Sep 2020.

The Leverage Ratio measures the amount of loans relative to the bank's equity. It is similar to the Debt-to-Equity ratio for other industries. For DBS, the leverage ratio is 6.9 times in Sep 2020.

Other Ratios

Other ratios include Return on Assets (ROA) and Return on Equity (ROE). These ratios should be familiar with investors since they also apply to other industries. Another ratio is the Cost-to-Income Ratio, which measures how efficient the bank is in controlling costs relative to income. Some banks also report the Non-Interest Income to Total Income Ratio, which measures how much income the bank generates outside its lending business. A higher ratio means that there is great diversity in the income sources.

Conclusion

This blog post explains the operating and financial metrics that are relevant to banks. With this information, hopefully investors will be able to understand the financial performance of banks better.


See related blog posts:

Sunday, 14 June 2020

Things Don't Look Good for Retail Landlords

The massive sell-down in Mar brought many REITs to rare, multi-year lows. This re-ignited my interest in REITs, as I have been out of them for many years due to their increasing debt levels and decreasing yields. However, I passed up the opportunity while I analysed what could be the impact of COVID-19 on REITs. Despite the massive government interventions, things do not look good for retail and F&B companies. And when tenants struggle, their landlords will also suffer. In this blog post, I will examine the potential impact of COVID-19 on 2 retail companies and 2 F&B companies.

Before we begin, it is good to recap what are the measures the government has taken to cushion the impact on retail and F&B companies. 

Wage Support

Through 4 extraordinary budgets, the government will provide support to wages via the Job Support Scheme (JSS). The level of wage support varies across industries. The JSS will last for 10 months. For the first 2 months, it will cover 75% of $4,600 of wages of all local employees for all companies. The 75% support level will continue if companies are not allowed to operate during the gradual lifting of Circuit Breaker, until Aug. For the remaining months, the wage support will be as shown in Fig. 1 below.

Fig. 1: JSS Support for Remaining Months

Thus, both retail and F&B companies will get the following wage support:
  • 3 months of 75% wage support (assuming they are allowed to reopen in Jul)
  • 7 months of 50% wage support
This translates to 48% reduction in annual wage costs for FY2020 (assuming that all wages of employees are at $4,600).

Rental Relief

In addition to wage support, the government has also implemented measures to help companies cope with rental costs. The Government will provide property tax rebates and cash grants equivalent to 2 months' rent for qualifying commercial properties and 1 month's rent for industrial and office properties for Small and Medium Enterprises (SMEs) with annual turnover of less than $100M. On top of that, the government also passed a law requiring landlords to waive 2 months' rent for commercial properties and 1 month's rents for industrial and office properties for SMEs that have seen a significant drop in their monthly revenues. The total amount of rental relief for SMEs in commercial and industrial/ office properties is summarised in Fig. 2 below.

Fig. 2: Rent Relief for SMEs

Thus, retail and F&B SME companies will get up to 4 months of rental relief, translating to a 33% reduction in annual rental costs for FY2020.

Revenue Hit

COVID-19 has stopped people from shopping and dining out, either because of government-mandated lockdowns or fear of contracting the virus. It is anyone's guess how soon people will go back to their normal lifestyles after shops and F&B outlets are allowed to operate. China is the first country to exit the lockdown and provides the first glimpse of how consumers would react in a post-COVID world. Figs. 3 and 4 below from Capitaland Retail China Trust's (CRCT) investor conference in May shows that shopper traffic is only picking up gradually after the end of the lockdown. Year-on-year, total shopper traffic and tenants' sales in 1Q2020 declined by 37.6% and 42.5% respectively.

Fig. 3: Shopper Traffic at CRCT Malls in 1Q2020

Fig. 4: Tenants' Sales at CRCT Malls in 1Q2020

For the revenue hit on retail and F&B companies, I assume the following:
  • 3 months of closure during Circuit Breaker: 0% revenue
  • 2 months of gradual re-opening: 50% revenue
  • 7 months of recovery: 80% revenue
This translates to a 45% decline in annual revenue for FY2020. Will retail and F&B companies survive this kind of harsh business conditions? Let us take a look at 2 retail companies and 2 F&B companies.

Retail Companies

Company F

Company F is a barely profitable retail company. In FY2019, it generated net profit of $0.2M. See Fig. 5 below for its income statement for FY2019.

Fig. 5: Company F's Income Statement for FY2019

It is insightful to note that of the gross profit of $64.7M, staff costs ($21.4M) take up 33% of the gross profit and rental costs ($22.3M) take up another 34% of the gross profit. In total, staff and rental costs take up 68% of gross profit. It is no wonder that the government had to act quickly to relieve the pressure of staff and rental costs on companies!

Applying the estimated declines in revenue, staff and rental costs above (plus some other assumptions for other costs), Company F might see its net profit turn from positive $0.2M to negative $5.4M. See Fig. 6 below for the computation.

Fig. 6: Estimated Impact of COVID-19 on Company F

As at end FY2019, Company F had cash of $7.8M. The estimated loss of $5.4M is equivalent to 69% of its cash and 10% of its equity.

Company C

Company C is a fairly profitable retail company. In FY2019, it generated net profit of $17.7M. Applying the same analysis as Company F, Company C might see its net profit reduced from $17.7M to $9.1M. See Fig. 7 below for the computation. Company C will likely have no problem going through the COVID-19 situation.

Fig. 7: Estimated Impact of COVID-19 on Company C

F&B Companies

Company S

Company S is a barely profitable F&B company. In FY2019, it generated net profit of $0.8M. See Fig. 8 below for its income statement for FY2019.

Fig. 8: Company S's Income Statement for FY2019

Like retail companies, staff and rental costs take up a large portion of the gross profit of F&B companies. Staff costs ($14.3M) take up 43% of gross profit and rental costs ($7.9M) take up another 24% of gross profit. In total, staff and rental costs take up 66% of gross profit.

Applying the same analysis, Company S might see its net profit turn from positive $0.8M to negative $2.6M. See Fig. 9 below for the computation. The estimated loss is equivalent to 32% of its cash and 27% of its equity as at end FY2019.

Fig. 9: Estimated Impact of COVID-19 on Company S

Company J

Company J is a fairly profitable retail company. In FY2019, it generated net profit of $10.9M. Applying the same analysis as Company F, Company J might see its net profit reduced from $10.9M to $1.9M. See Fig. 10 below for the computation. Company J will likely have no problem going through the COVID-19 situation.

Fig. 10: Estimated Impact of COVID-19 on Company J

Conclusion

We have run through the estimated impact of COVID-19 on 2 retail and 2 F&B companies. Staff and rental costs consistently take up around 2/3 of gross profits. When there is no or poor business due to government-mandated lockdowns or fear of contracting the virus, the impact on the bottom lines of retail and F&B companies is very significant. As in all crises, stronger companies with leaner cost structures and/or significant retained earnings will be able to weather the storm while weaker ones will end up in losses, despite the extraordinary government interventions. 

The companies I analysed above are all listed companies. How about unlisted companies? Would they have stronger financials than listed companies? Some food for thoughts.

Last week, Department of Statistics released the retail and F&B sales figures for Apr 2020. Fig. 11 below shows that retail sales declined by 13.3% in Mar (before Circuit Breaker) and 40.5% in Apr (during Circuit Breaker) on a year-on-year basis. Almost all sectors were impacted, with the exception of Supermarts & Hypermarts, Mini-marts & Convenience Stores, and to some extent, Computer & Telco Equipment.

Fig. 11: % Changes in Retail Sales

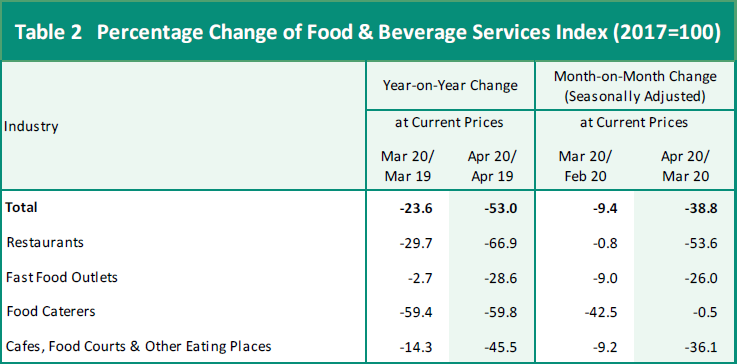
Fig. 12 below paints a similarly bleak picture for F&B sales, with a decline of 23.6% in Mar and 53.0% in Apr on a year-on-year basis. No F&B sector escaped the decline.

Fig. 12: % Changes in F&B Sales

Lastly, Fig. 13 below shows the tenant mix at Frasers Centrepoint Trust's Malls.

Fig. 13: Tenant Mix at Frasers Centrepoint Trust's Malls

F&B accounts for 38% of Gross Rental Income. Fashion takes up 14% while Beauty & Health accounts for 11%. All these sectors will be impacted by COVID-19. The only sector that has a roaring business during COVID-19, Supermarts & Hypermarts, contributes only 5% of the Gross Rental Income.

In conclusion, COVID-19 has resulted in a very challenging business environment for retail and F&B companies. When tenants struggle, landlords will also suffer. Things do not look good for retail landlords.

P.S. I am vested in Capitaland.


See related blog posts:

Sunday, 5 April 2020

Not All Hospitality Trusts Are Created Equal

In the past 2 months, investors have been selling off Hospitality Trusts (HTs) listed on SGX due to travel restrictions imposed by governments around the world to stem the spread of COVID-19. There are 6 HTs listed on SGX, namely:
  • ARA US HT
  • Ascott Residence Trust
  • CDL HT
  • Eagle HT
  • Far East HT
  • Frasers HT
While all hotels will suffer revenue decline due to the travel restrictions, not all HTs will be impacted by the same extent. One important factor affecting the impact on HTs is their operating models. Traditionally, hotels have been owned and operated by the same party, but there are increasingly more investors who wish to invest in hotels but might not have the expertise or time to manage them. Thus, hotels might be owned by one party but operated by another, with revenue-sharing agreements between them. If you buy into HTs, you are buying into the ownership of the hotels. The operating model adopted by the HT will affect how the revenue and/or profit are shared between the owners (i.e. HTs) and the operators (i.e. hotel chains like Mariott, Hilton, Accor, etc.).

Some of the major operating models are as follow:
  • Owner Operated - The owner owns and operates the hotel, bears all costs and risks, and receives all profits. HTs usually do not adopt this model.
  • Master Lease - This is the simplest model when the owner and operator are different parties. The owner leases the hotel property to the operator in return for a fixed rental fee. The operator bears all costs and risks of operating the hotel. The owner does not have any share in the profits from operating the hotel. Nevertheless, there are variants to this model in which the rental can be variable and pegged to a percentage of the hotel revenue and/or profit. 
  • Management Contract - In this model, the owner engages the operator to run the hotel. The operator receives a management fee which is pegged to a percentage of the hotel revenue and profit. The owner bears all costs and risks of operating the hotel and receives all profits after deducting the costs and management fee to the operator.
  • Franchise - In this model, the owner runs the hotel using the franchisor's brand. The franchisor receives a franchise fee which is pegged to a percentage of the hotel revenue. The owner bears all costs and risks of operating the hotel and receives all profits after deducting the costs and franchise fee. A variant of this model is the owner outsources the operation of the hotel to an independent third-party operator. This arrangement is similar to a management contract, except that the third-party operator is not associated with the franchisor.
Fig. 1 below summarises the responsibilities of the owner and the operator/ franchisor in running the hotel.
Fig. 1: Various Hotel Operating Models

Needless to say, given the severe travel disruptions currently in place, the master lease model (especially the fixed rental model) would have the least impact to the revenue received by the HTs. Let us look at the operating model adopted by each of the HTs. Do note that a lot of these information are sourced from the annual reports. For HTs whose financial years end in Dec, the FY2018 annual reports are the latest ones available.

ARA US HT

ARA US HT owns 41 hotels, of which 38 carry the brand of Hyatt and 3 carry the brand of Mariott. Fig. 2 below shows the operating model adopted.

Fig. 2: ARA HT's Operating Model

The figure shows that all of ARA US HT's hotels are franchised by Hyatt and Mariott and operated by independent third-party operators.

As explained in the section above, under the franchise model, all costs and risks are borne by ARA US HT, which is not a good thing during the current COVID-19 situation.

Ascott Residence Trust (ART)

ART owns 87 hotels and serviced residences. It recently merged with Ascendas HT to form the largest HT in Asia Pacific. ART adopts a combination of master leases and management contracts. Fig. 3 below shows the breakdown of gross profit from the various operating models in 4Q2019.

Fig. 3: Breakdown of ART's Gross Profit in 4Q2019

25% of the gross profit comes from master leases, while another 13% comes from management contracts with minimum guaranteed income.

Notwithstanding the above, there are fixed and variable rent components in the leases. ART disclosed that its operating lease receivable within 1 year of FY2018 is $70.3M. This is based on the fixed rent component in the leases. This amount represents only 14% of both the gross rental income and total revenue (rental and other income) in FY2018. In the worst case scenario whereby there is only fixed rental income, ART could see its revenue dropping by 86%.

CDL HT

CDL HT owns 16 hotels, 2 resorts and 1 retail mall across 8 countries. It has a combination of master leases, management contracts and owner-operated hotel. Fig. 4 below shows the operating model.

Fig. 4: CDL HT's Operating Model

Of the 19 properties, 13 are under master leases, 4 are under management contracts and 2 are owner-operated.

Although master leases form the majority of the hotels, they have fixed and variable rent components. Fig. 5 below compares the minimum and actual rental income received in FY2018.

Fig. 5: Minimum & Actual Rental Income for Master Leases

In total, the minimum rental income from all master-leased hotels forms only 49% of the actual rental income received in FY2018. As a percentage of total revenue, the minimum rental income constitutes only 35%. In the worst case scenario whereby there is only minimum rental income, CDL HT could see its revenue dropping by 65%.

Thus, although the majority of CDL HT's hotels are under master leases, the variable rent component in these master leases reduces the stability of income received by CDL HT in situations like COVID-19.

Eagle HT

Eagle HT was listed on SGX recently. It owns 18 hotels in US, most of which carry the brands of IHG, Mariott and Hilton. The operating model appears similar to that of ARA US HT, i.e. franchise model.

Far East HT

Far East HT owns 9 hotels and 4 serviced residences in Singapore. Fig. 6 below shows the operating model adopted.

Fig. 6: Far East HT's Operating Model

All their hotel and serviced residence properties are master leased to its sponsor, Far East Organisation and its related subsidiaries. Although Far East HT did not disclose the fixed and variable rent components of the master leases, it disclosed that its operating lease receivable within 1 year of FY2018 is $85.1M. This is based on the fixed rent in the master leases. This amount represents 93% of the rental income received from master leases and 75% of total revenue in FY2018. In the worst case scenario whereby there is only fixed rental income, Far East HT could see its revenue dropping by 25%.

Frasers HT

Frasers HT owns 9 hotels and 6 serviced residences in 6 countries. 14 of the properties are under master leases and 1 is under management contract. Like all HTs, the master leases have fixed and variable rent components. Fig. 7 below shows the minimum and actual rental income received in FY2019.

Fig. 7: Minimum & Actual Rental Income for Master Leases

In total, the minimum rental income forms only 49% of the rental income received from master leases and 38% of total revenue in FY2019. In the worst case scenario whereby there is only minimum rental income, revenue can fall by 62%.

Conclusion

The table below summarises the operating models adopted by the various HTs listed on SGX. For HTs with master leases, the table also shows the minimum rental income from master leases as a percentage of their total revenue.

Hospitality Trust Operating Models Min. Lease Rental
as % of Revenue
ARA US HT Franchises Not Applicable
ART Leases, Mgt Contracts 14%
CDL HT Leases, Mgt Contracts & Owner-Operated 35%
Eagle HT Franchises Not Applicable
Far East HT Leases 75%
Frasers HT Leases, Mgt Contracts 38%

Like most REITs, HTs have been well-liked by dividend investors. However, as this blog post shows, the revenue received by HTs is highly variable, depending on the operating model adopted. In theory, master leases provide the greatest stability compared to management contracts and franchises. However, most master leases of HTs have fixed and variable rent components. The higher the variable rent component, the more variable is the revenue stream. Dividend investors should really consider whether HTs should form part of their portfolios.

Although the segregation of roles and responsibilities between the owner (i.e. HT) and the operator through the various operating models splits the risks between them, it is ultimately a zero-sum game. When the hospitality industry faces a severe downturn like the current COVID-19 situation, neither the owner nor the operator wins. Even when the owner is relatively shielded at the expense of the operator via master leases with fixed rentals, investors need to check the credit risks of the operator. If the operator cannot pay the fixed rentals, the owner will also lose. Investors in hotel companies and HTs can only pray that the COVID-19 crisis is resolved quickly.


See related blog posts:

Monday, 21 May 2018

Who Moved Starhub's Cheese?

Starhub has been facing declining profitability in the last few years. It even had to cut its 20-cent annual dividend last year, a dividend which it had held steady for 7 years. Why did Starhub face declining profitability and who moved Starhub's cheese? To discuss these questions, we need to first understand what were Starhub's competitive advantages in the past and how have they changed.

Starhub's Moats

Traditionally, compared to its 2 rivals, Starhub has the advantage of using its cable network infrastructure to deliver both cable TV and cable broadband services, thus enabling it to spread out the cost of operating the infrastructure over a larger number of customers.

In addition, compared to M1, which until recent years only offered mobile services, Starhub (and also Singtel) has the hubbing strategy which offers customers discounts if they sign up for 3 services, namely, mobile line, home broadband and Pay TV. The discounts range from 5% to 30% for different services. Thus, if a customer needs mobile lines, home broadband and Pay TV, he would find it attractive to sign up all services with Starhub (or Singtel) and enjoy the hubbing discounts. This hubbing strategy has allowed Starhub and Singtel to gain market share relative to M1 in the post-paid mobile services market. See Fig. 1 below for the changes in market share of the 3 telcos and the percentage of households who are members of Starhub's Hub Club.

Fig. 1: Post-Paid Mobile Service Market Share

Hence, for a long time, Starhub had been enjoying a moat which seemed impregnable. 

Cable Broadband

The first crack in Starhub's hitherto impregnable moat is cable broadband. In 2010, the Next Generation Nationwide Broadband Network (NGNBN) started operations. Instead of only Starhub and Singtel being able to offer home broadband via their cable and ADSL networks respectively, the market was suddenly opened up to many other companies, including M1, MyRepublic, ViewQwest, etc. With more competitors, prices of home broadband dropped. In addition, as more customers switch from cable broadband to fibre broadband, there are less customers to spread the cost of operating the cable network infrastructure. See Fig. 2 below for the declining number of cable broadband customers. 

Fig. 2: Proportion of Cable and Fibre Broadband Customers

Although Starhub's cable broadband market share declined, its hubbing strategy is still intact. Customers who need mobile lines, Pay TV and home broadband, regardless whether it is cable or fibre broadband, would still find it attractive to sign up with Starhub to enjoy the discounts. Nevertheless, it should be noted that M1 is now able to offer a hubbing strategy for customers to sign up mobile lines and fibre broadband. Customers who do not need Pay TV would enjoy hubbing discounts with M1 but not Starhub and Singtel.

Pay TV

With faster and more reliable broadband speed comes the ability to watch videos online. Furthermore, online viewers are not restricted to watching video on the TV; they could watch it anywhere and on the move. This has resulted in cord-cutting by Pay TV subscribers, and this trend is not limited to Singapore alone. 

In Jan 2016, Netflix entered the Singapore market, offering not only a cheaper way of watching movies but also bringing in popular exclusive original content. See Is Pay TV Still A Reliable Cash Cow? for more information. Since then, the decline in the number of Pay TV subscribers at both Starhub and Singtel has accelerated, despite the retention power of their hubbing strategies. See Fig. 3 below for the number of Pay TV subscribers. 

Fig. 3: No. of Pay TV Subscribers at Starhub and Singtel

With the decline in Pay TV subscribers, there is further reduction in the number of customers to spread the cost of operating the cable network infrastructure. The traditional competitive advantage that Starhub has in the cable TV network infrastructure is irreversibly gone.

Furthermore, the proportion of households on Starhub's Hub Club has also declined. See Fig. 1 above. Thus, with the onslaught of streaming video on demand, even Starhub's hubbing strategy is no longer as impregnable. If anything, the hubbing advantage has tilted towards M1 which requires only 2 services instead of 3 services for Starhub and Singtel.

Mobile Services

Mobile Services is the largest segment of all 3 telcos. In the last few years, it has faced many headwinds. The traditional money generator for telcos, Short Message Service (SMS), has now been superseded by messaging apps like WhatsApp, WeChat, etc. Likewise, voice is also seeing a decline as it is being replaced by WhatsApp calls, Skype, etc. Only data is seeing increasing demand. But even in this area, competition has increased. In 2016, M1 launched data upsize plans that allow subscribers to increase their data bundles with a slight increase in monthly fees. This has the effect of reducing the excess data charges that subscribers pay when they exceed their data bundles. See Impact of Data Upsize Plans on Telcos for more information.

Also in 2016 and again in recent months, new virtual telcos known as Mobile Virtual Network Operators (MVNOs) have sprung up. These MVNOs buy network capacity from traditional telcos and resell to retail customers. They cater to niche customer segments and usually dangle attractive offers, such as Circles.Life's $20-for-20GB of data, ZeroMobile's Unlimited Everything and Zero1's unlimited data for $29.99. See Will MVNOs Cannibalise Telcos' Business?

In addition, there have been other disruptions to the telco industry, such as the SIM-only plans, which attract customers who do not need to change their phones every 2 years. These plans reduce the revenue but are value accretive at the EBITDA level. See Will SIM-Only Plans Cannibalise Regular Telco Plans? for more information. Finally, there is also the fourth telco which is scheduled to start operations in Jan next year. See Where Art Thou, TPG?

Conclusion

In conclusion, Starhub is facing headwinds in many business segments. The party that is moving Starhub's cheese is not a single actor. Many actors have been moving Starhub's cheese. 

P.S. I am vested in M1, Netlink Trust and Singtel.


See related blog posts:

Monday, 14 May 2018

A Satisfied M1 Investor

I started investing in M1 in Jan last year. At that time, it was to take advantage of the crash in telco stocks due to fear of the fourth telco. Since then, I have added to my positions several times. My current position is now 5 times the initial one. This is because despite all the headwinds that telcos face, from SIM-only plans, data upsize plans, Mobile Virtual Network Operators (MVNOs) to the fourth telco, M1 has performed admirably. Below is a summary of what I like about M1.

SIM-Only Plans

When M1 launched SIM-only plans in Jul 2015, I had not invested in telco stocks yet. But my initial thoughts were that SIM-only plans would lead to a drop in revenue and a smaller drop in profitability, as SIM-only plans would lead to some subscribers downgrading from the more expensive regular telco plans with handphone subsidies to the SIM-only plans. See Impact of SIM-Only Plans on Telcos. As it turns out, although SIM-only plans indeed led to a drop in revenue, they are value-accretive at the EBITDA level, as they attract new customers in addition to existing subscribers who downgrade. An analogy would be the regular telco plans are like full-service airlines while SIM-only plans are like budget airlines. Although SIM-only plans cannibalise regular telco plans, they also create new demand of their own. See Will SIM-Only Plans Cannibalise Regular Telco Plans? for more information. The popularity of SIM-only plans (together with Circles.Life) has led to strong growth in M1's post-paid customer base. See Fig. 1 below for the growth rate (note: M1's post-paid customer base includes that of Circles.Life, the MVNO that works with it).

Fig. 1: Changes in M1's Post-Paid Customers

In this aspect, I have to acknowledge that M1 knows what it is doing and is doing better than I thought.

Data Upsize Plans

This is another initiative that M1 started in Mar 2016 before I became a shareholder. Again, I believed that this would lead to lower profitability, as subscribers who used to exceed their data bundles and pay excess data charges of as high as $10.70/GB now need to pay only $5.90 per month to upsize their data bundles. See Impact of Data Upsize Plans on Telcos

This time, I am not wrong about the impact on revenue and profitability, but M1 has bigger plans. Instead of stopping at 3 levels of upsize, M1 launched big data plans in Aug 2017, including an unlimited data plan. The big data plans are clearly ahead of competition, which is quite unusual since all telcos will try to match each other. See No Competition for M1's Big Data Plans for more information. M1's prices are comparatively lower than that of the other 2 telcos, so much so that I feel that M1 did not maximise profits by pricing them closer to the competition (but also see the section on Narrowband Internet of Things).

Mobile Virtual Network Operators (MVNOs)

Long before the recent spate of MVNOs like Zero Mobile, Zero1 and MyRepublic, M1 had already worked with a MVNO called Circles.Life in May 2016 to roll out mobile services to niche segments of customers that M1 did not cater for. Since MVNOs have to buy network capacity from traditional telcos, they will never be able to offer a better deal than traditional telcos on a sustainable basis. So, MVNOs are a way of getting some extra revenue from niche market segments without taking the risks.

I would like to say that the collaboration with Circles.Life has been a successful one. Customer numbers have been increasing as shown in Fig. 1 above. Furthermore, Singtel and Starhub have recently been copying M1 in working with MVNOs as TPG's timeline for setting up operations in Singapore by Dec 2018 approaches. As they say, imitation is the best form of flattery. 

I might be wrong in this aspect, but I somehow suspect that M1 learnt something useful from Circles.Life's operations. Customers of Circles.Life use an app known as CirclesCare to manage their plans, including activating additional services on-demand. See CirclesCare features. M1's app has similar features, which saves customers' time from not having to call the customer service line and reduces the no. of staff they need to service customers. 

Narrowband Internet of Things (NB-IoT)

NB-IoT is a new 4.5G network designed for machine-to-machine communications to facilitate Internet-of-Things (IoT). Like most other new services, M1 is the first telco to roll out this new service in Aug 2017. There are some advantages in being the first mover and the lowest cost provider in big data, but it is still a fairly new service and not many companies are ready to launch IoT devices, so it is worth watching whether this new service will bring in good revenue for M1.

In an earlier section on data upsize plans, I mentioned that although M1 has a cost advantage in big data, it has not taken advantage of it to maximise profits. This might be because M1 is trying to attract more companies to use its NB-IoT services. Once on board, M1 could upsell to customers its data analytics services to derive better value. Furthermore, compared to traditional 4G services that cater to individuals, NB-IoT has higher switching costs and hence, customers are less likely to switch to a different telco. See NB-IoT – The Next Frontier for Telcos for more information. Thus, I am willing to accept that M1 has priced its big data plans lower than necessary to capture this new market segment.

Overall

M1 is the smallest telco in Singapore. Perhaps cognisant of its small size, it has always been willing to try out new things. It is the first telco to launch 3G mobile services in Feb 2005, mobile broadband in Dec 2006, fibre broadband in Sep 2010, 4G mobile services in Sep 2012, 4.5G mobile services in Dec 2014, etc. Nevertheless, despite being the first to deliver, it has always come in last in terms of market share. Yet, it knows that if it is not the first to deliver, it will not only come in last, but also become irrelevant, given that it had no Pay TV, cable/DSL broadband and analogue/digital voice businesses (before the Next Generation Nationwide Broadband Network came on board and disrupted the playing field). To stay relevant and survive, M1 has to constantly innovate. Innovations are in M1's DNA.

The innovations mentioned in earlier sections represent a desire to disrupt itself and competitors to stay ahead of the competition. Contrary to conventional wisdom, the disruptions in the telco industry in recent years did not come from the fourth telco; they came from M1 (and Singtel to a smaller extent). All these disruptions have also made the fourth telco fairly irrelevant, even if TPG were to start operations in Dec 2018 as scheduled. M1 has established a clear lead in big data (for now) and a toehold in NB-IoT. Perhaps this time round, it would not come in last among the 3 telcos.

On my investment in M1, despite averaging down 4 times, I am still sitting on a small paper loss. Nevertheless, the actions that M1 took make me confident that it is a matter of time before the market recognises M1 is a technology disruptor rather than the disrupted and the share price recovers to my cost price. I am satisfied with my investment in M1.

P.S. I am vested in M1, Netlink Trust and Singtel.


See related blog posts:

Monday, 7 May 2018

NB-IoT – The Next Frontier for Telcos

NB-IoT sounds like the name of a robot, but it stands for Narrowband Internet of Things. You probably have heard of Internet of Things (IoT), in which every device is collecting data and connected to the internet. As an example of the benefits of IoT, an IoT fridge can keep track of the groceries stored inside. If any grocery were to run low, it can place an order for fresh groceries to be delivered to your home automatically. You do not need to worry about groceries running low any more. It is an exciting future, isn't it? For the IoT fridge to be able to place orders online, it needs to be connected to the internet, either through WiFi at home or the telco network. Herein comes the NB-IoT. It is a 4.5G telco network that caters for machines instead of humans. NB-IoT is not the only telco network that machines can get connected to the internet, neither will it be the final telco network, but for now, it is a feasible network that enables IoT to take off.

M1 is the first telco to launch NB-IoT in Aug 2017. This is followed by Singtel in Feb 2018. Starhub's roll-out is still in progress, together with its enhancement of the 4G peak speed from 400Mbps to 1Gbps. How is the NB-IoT network going to play out for telcos?

Unlike the 4G networks that cater for human-to-human communications, there is an inherent advantage that incumbent telcos have in NB-IoT networks, which is switching cost. It is easy for 5 million people in Singapore to replace the SIM cards of their 8 million handphones to that of a different telco, but it is not easy for, say, an utility company to replace the SIM cards of the smart power meters in 1 million homes. To do so, they have to incur much manpower and transport costs to visit these smart power meters. Thus, if the differences in monthly subscription costs from other telcos are not too much, customers are unlikely to switch to a different telco. First-movers will have some advantages. Having said that, NB-IoT is still fairly new and not many companies are ready to launch NB-IoT devices now.

In the area of data costs, M1 seems to have an edge for now. If you read last week's post on No Competition for M1's Big Data Plans, it appears that M1 has a cost advantage over the other 2 telcos on big data.

Although NB-IoT holds promises with millions of devices to be connected up, I am still not particularly excited over telcos' prospects. The key question I have is that is the NB-IoT service that telcos provide a dumb pipe or a smart pipe? If it is a dumb pipe, any telcos could have provided the connectivity and price competition would be present. However, if it is a smart pipe, telcos would be able to hold off the competition and derive better value from NB-IoT.

Let us consider M1's collaboration with Otto Waste Systems and SmartCity Solutions to implement an intelligent waste management system based on NB-IoT. The sensors used to determine whether the bins are full is provided by Otto Waste Systems, while the centralised management system to monitor which bins need to be cleaned is provided by SmartCity Solutions. M1 provides the NB-IoT connectivity and the data analytics to determine the distribution of bins and the frequency of collection. Based on this description, M1's pipe is a half-dumb pipe. They could derive some additional value from the provision of data analytics, but M1 is not the only telco that has such data analytics capabilities. Otto Waste Systems and SmartCity Solutions could have worked with any other telcos and still not suffer a drop in the quality of service.

In conclusion, NB-IoT is the next frontier for telcos. Unlike 4G networks, telcos can better hold on to their customers because of high switching costs. They probably also can derive more value from the provision of data analytics to their customers, but some levels of price competition among telcos will still be around. 

P.S. I am vested in M1, Netlink Trust and Singtel.


See related blog posts:

Sunday, 29 April 2018

No Competition for M1's Big Data Plans

Usually, the 3 local telcos are very competitive. Whenever 1 launches a new service, the other 2 will follow quickly. However, for the new big data plans that M1 launched in Aug 2017, the follow-ups have been fairly feeble. Starhub launched its unlimited weekend data plans immediately, but that came with additional monthly subscription fees of $5.10. Only Singtel came up with something close, offering a Data X Infinity add-on for unlimited data for additional $39.99 per month 2 weeks later. However, that add-on only applies to higher mobile plans. Let us look at the offerings from each telco.

Do note that M1's big data plans do not come with much talktime and SMS. All the big data plans (except for the most expensive one) have only 100 mins of talktime and 100 SMS. For extra talktime, there are add-ons that range from $5 (for extra 200 mins) to $15 (for unlimited talktime). These big data plans do not replace M1's more traditional mobile plans that have a balance of talktime, SMS and data. For Singtel and Starhub, there are no new mobile plans that are equivalent to M1's big data plans. They are just enhancing their existing mobile plans to add more data. Thus, the comparison below is not a like-for-like comparison. However, for users who use a lot of data, this comparison is relevant.

M1 Plans
mySIM 40 mySIM 70 mySIM 90 mySIM 118
Monthly Cost
$40.00 $70.00 $90.00 $118.00
Data (GB)
5 15 30 Unlimited

Singtel Plans Combo 1 Combo 2 Combo 3 Combo 6 Combo 12
Monthly Cost $27.90 $42.90 $68.90 $95.90 $239.90
Data (GB) 0.1 2 3 6 12
Data X2 Cost - $48.80 $74.80 $101.80 $245.80
Data X2 (GB) - 4 6 12 24
Data X3 Cost - $52.80 $78.80 $105.80 $249.80
Data X3 (GB) - 6 9 18 36
X Infinity Cost - - $108.80 $135.80 $279.80
X Infinity Data - - Unlimited Unlimited Unlimited

Starhub Plans XS S M L XL
Monthly Cost $48.00 $68.00 $88.00 $108.00 $238.00
Data (GB) 3 4 5 8 12
Plus 3 Cost $54.00 $74.00 $94.00 $114.00 $244.00
Plus 3 Data (GB) 6 7 8 11 15
DataJump Cost - $78.00 $98.00 $118.00 $248.00
DataJump Data (GB) - 9 15 23 32

At the low end of the spectrum, M1's plan for 5GB costs only $40 per month. Singtel's Combo 2 Plan with Data X2 add-on costs $48.80 (for 4GB) while Starhub's XS plan with Plus 3 add-on costs $54 (for 6GB). There is simply no competition at this end of the spectrum.

At the middle of the spectrum, M1's plan for 15GB costs $70. Singtel's Combo 6 plan with Data X2 add-on costs $101.80 (for 12GB) while Starhub's M plan with DataJump add-on costs $98 (for 15GB). Again, no competition.

At the high end with unlimited data, M1's plan costs $118. Singtel's Combo 3 plan with Data X Infinity add-on costs $108.80. Starhub has no credible response here. Although Starhub's plans offer unlimited data during weekends, they are not comparable to M1's and Singtel's unlimited data plans that are unlimited any time of the week. Thus, at this end of the spectrum, only Singtel is able to beat M1.

The figure below shows that subscribers are consuming more and more data. The average usage for M1 subscribers has risen from 3.2GB in 1Q2015 to 4.5GB in 1Q2018. The no. of subscribers who exceed their primary data bundle is also on the rise, from 20% in 1Q2015 to 29% in 1Q2018.  If this trend continues, and if the other 2 telcos do not start offering similar big data plans in the near term, M1 might grab a bigger share of the mobile services market.

Fig. 1: M1's data usage trend

P.S. I am vested in M1, Netlink Trust and Singtel.


See related blog posts:

Monday, 23 April 2018

Do M1's Acquisitions Make Sense?

It is a well known fact that competition among telcos has been heating up in the last couple of years. All 3 telcos have been finding new sources of revenue outside their traditional telco businesses. They have been busy acquiring companies, such as Singtel's acquisition of Turn for USD310M in Feb 2017 and Starhub's acquisition of D'Crypt for up to SGD122M in Dec 2017. In comparison, M1's acquisitions have been very small. So far, their acquisitions are as follow:
  • Aug 2016 - SGD3.0M for a 30% stake in Octopus Retail Management, which provides Point-of-Sales (POS) solutions for retailers and Food & Beverages (F&B) outlets.
  • Oct 2017 - SGD2.45M additional investment in Kliq, which provides digital mobile remittance service.
  • Apr 2018 - SGD3.0M for a 25% stake in Trakomatic, which provides Business-to-Business video analytics solutions to retailers.

Do these acquisitions have synergy with M1's existing businesses? Let us look at them one by one.

Octopus - Point-of-Sales

The POS solution is provided by Octopus Retail Management. This is an independently run business and not marketed together with M1's other services. As such, there is no synergy with M1's existing businesses. In fact, M1 has another mobile POS solution that is developed independently! To be fair, M1's in-house mPOS solution only facilitates payment transactions whereas Octopus' POS solution covers inventory tracking and customer loyalty programmes.

It is a bit difficult to see how this acquisition ties in with M1's overall business strategy. For FY2017, this associate lost $0.29M for M1.

Kliq - Digital Mobile Remittance Service

Though Kliq, M1 provides remittance service to 9 Asian countries such as Bangladesh, India, Philippines, etc. Users have to M1 customers. Payment for the remittance is made through AXS machines (which accept ATM, credit and debit cards), m-AXS mobile app (which accepts internet banking, credit and debit cards) and at M1 shops at IMM and Paragon  (which accept cash).

Although users have to be M1 customers, there is no integration with other M1 services. Users cannot pay for their remittance through their M1 monthly bills or their pre-paid stored value accounts. Furthermore, M1's share of the telco market is only 24.0%; by limiting the service to only M1 customers, they are effectively reaching out only to a small group of potential users.

I cannot see how this business ties in with M1's overall business strategy. Perhaps, someone from the remittance industry can see how it makes sense. In Oct 2017, M1 announced that it jointly invested an additional $5.02M in Kliq with Merchantrade Asia Sdn Bhd, thereby diluting its stake from 100% to 51%. Merchantrade is 20% owned by Axiata, one of M1's controlling shareholders.

Trakomatic - Video Analytics Solution

Trakomatic provides video analytics solutions to businesses to understand the movement and profiles of customers in their stores. The solutions can leverage on existing cameras and sensors that stores already have. This can complement M1's own data analytics solution, which analyses and provides similar information from the telco data of its customers. Trakomatic can provide information of customers within the store while M1 can provide information of potential customers in the vicinity of the store. Taken together, the data analytics created by M1 and Trakomatic will be more comprehensive and more valuable to businesses.

Conclusion

So far, M1 has acquired small stakes in 3 companies for a total of less than $10M. Among these 3 companies, 2 of them do not seem to complement its existing telco businesses very well. The more exciting acquisition is Trakomatic, which complements its data analytics business. M1 should be very careful about acquisitions, as its debts have been steadily climbing from $250M in Dec 2013 to $450M in Dec 2017.

P.S. I am vested in M1.


See related blog posts: